
Console Guide
Console Guide
Section titled “Console Guide”The KSquad console is a read-and-compose operator surface — it makes your fleet legible and lets you author and drive work, but it is deliberately not an IDE. It’s built for NOC-style density: your squads, Runs, artifacts, and audit trail at a glance, with live updates over SSE.
Screenshots. The images below are placeholders sourced from the v6 console mocks. The Graphic Designer finalizes the captured/annotated screenshots and their placement — see
CONTENT-NOTES.mdfor the mock → screenshot mapping. Filenames in the image tags refer to the v6 mock set.
This guide walks the console screen by screen.
Signing in
Section titled “Signing in”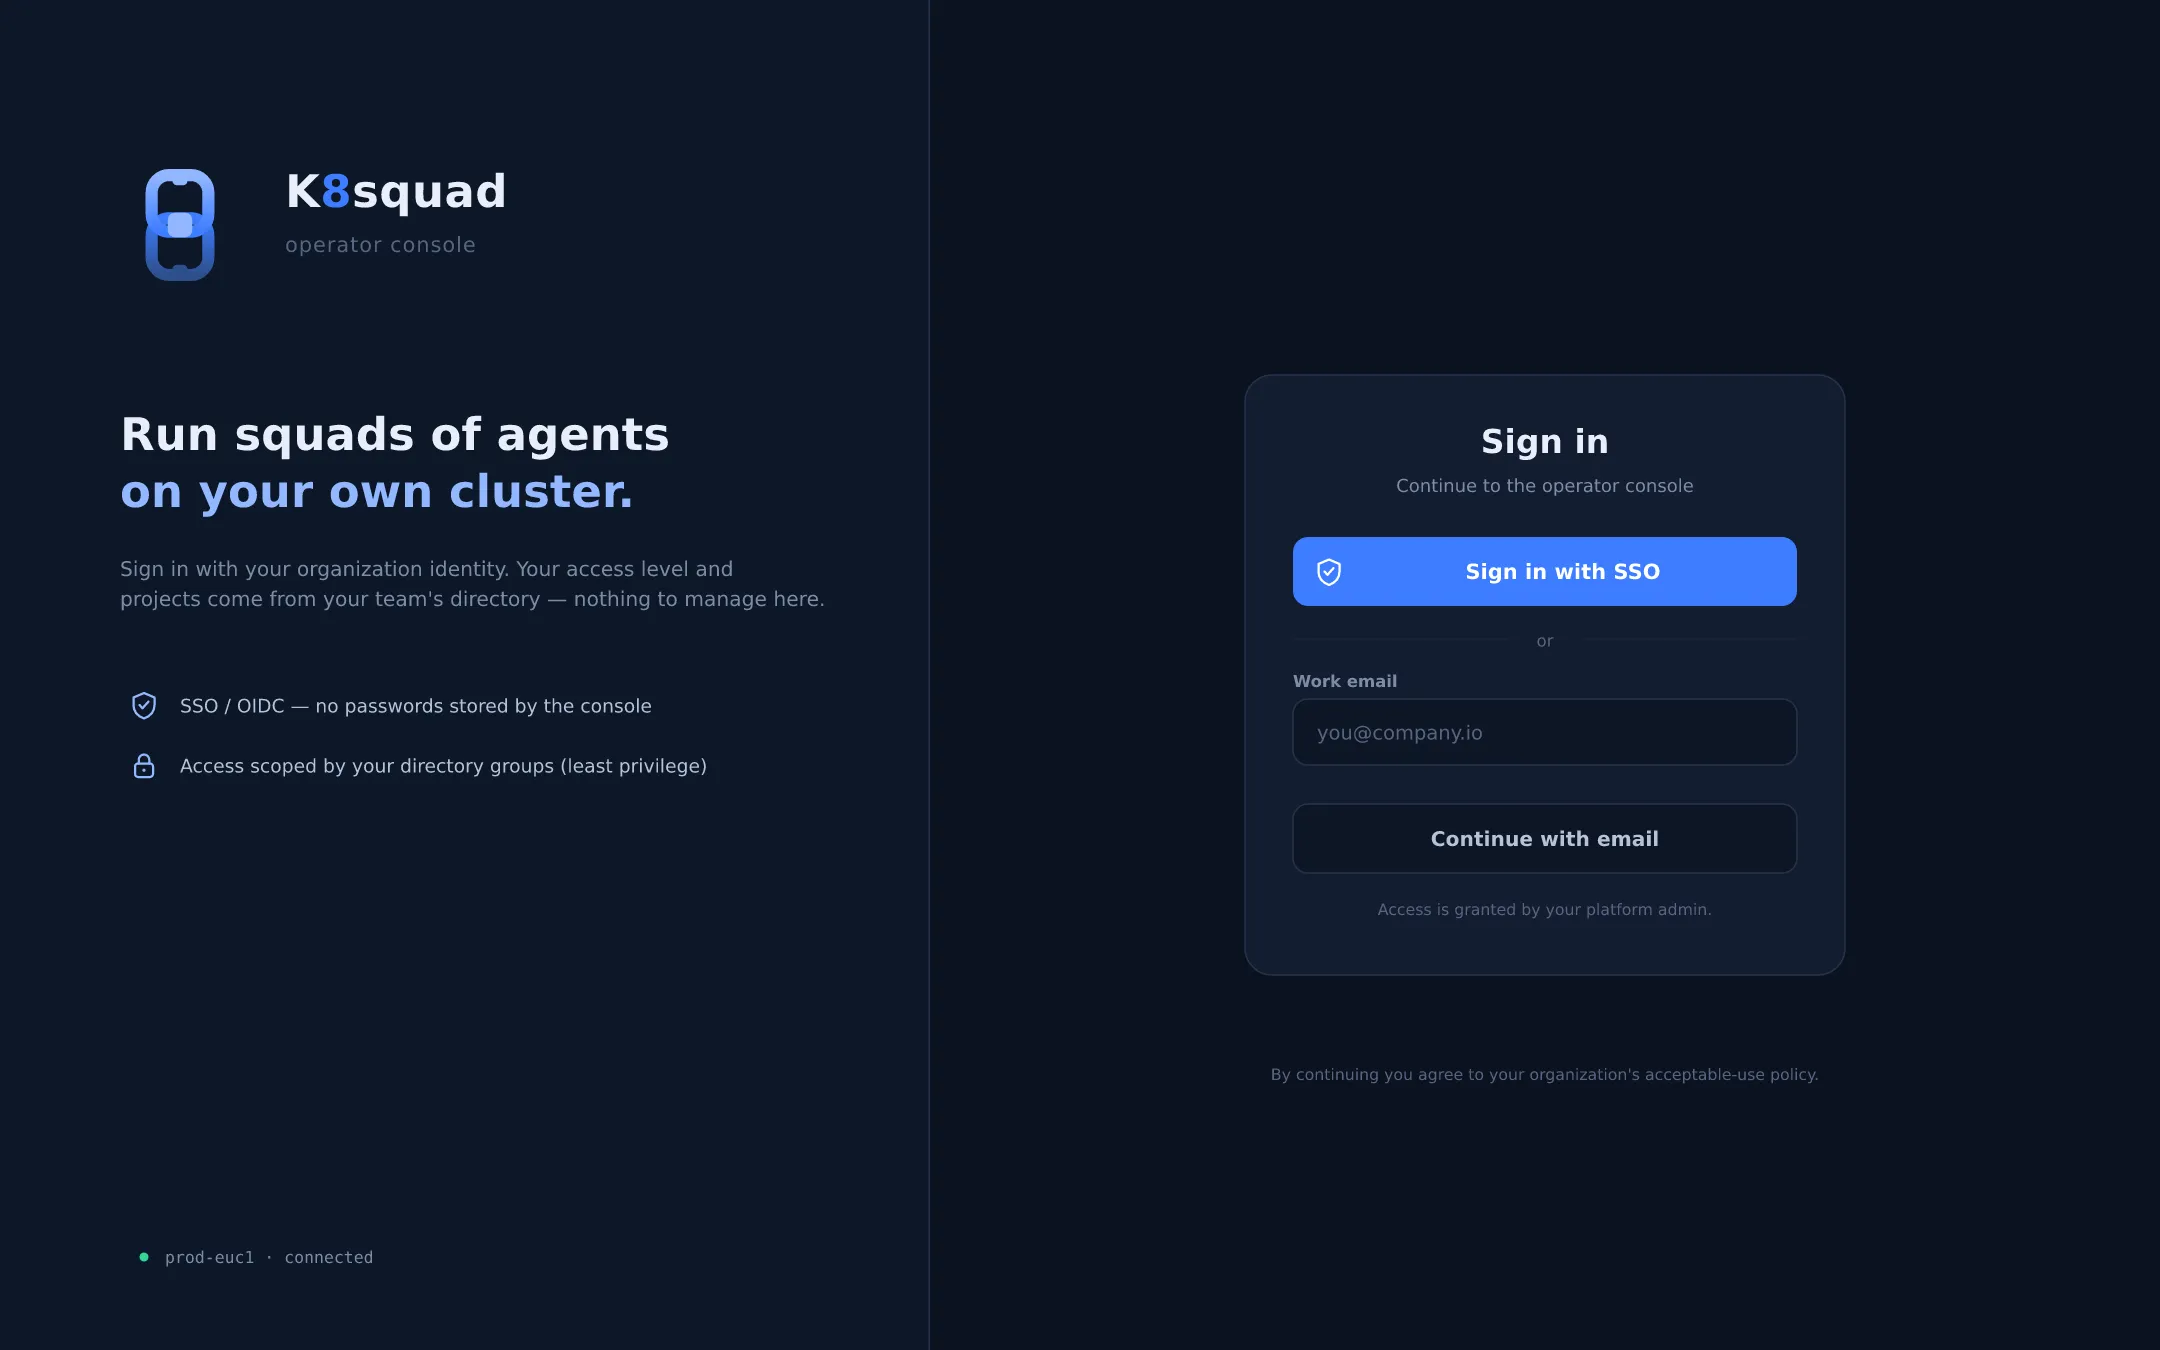
Log in with your username and password. On a fresh install you’ll use the bootstrap admin account
and be required to set a new password (see RBAC → first-run admin).
If your organization has enabled OIDC/SSO, you’ll sign in through your identity provider instead.
Navigation & information architecture
Section titled “Navigation & information architecture”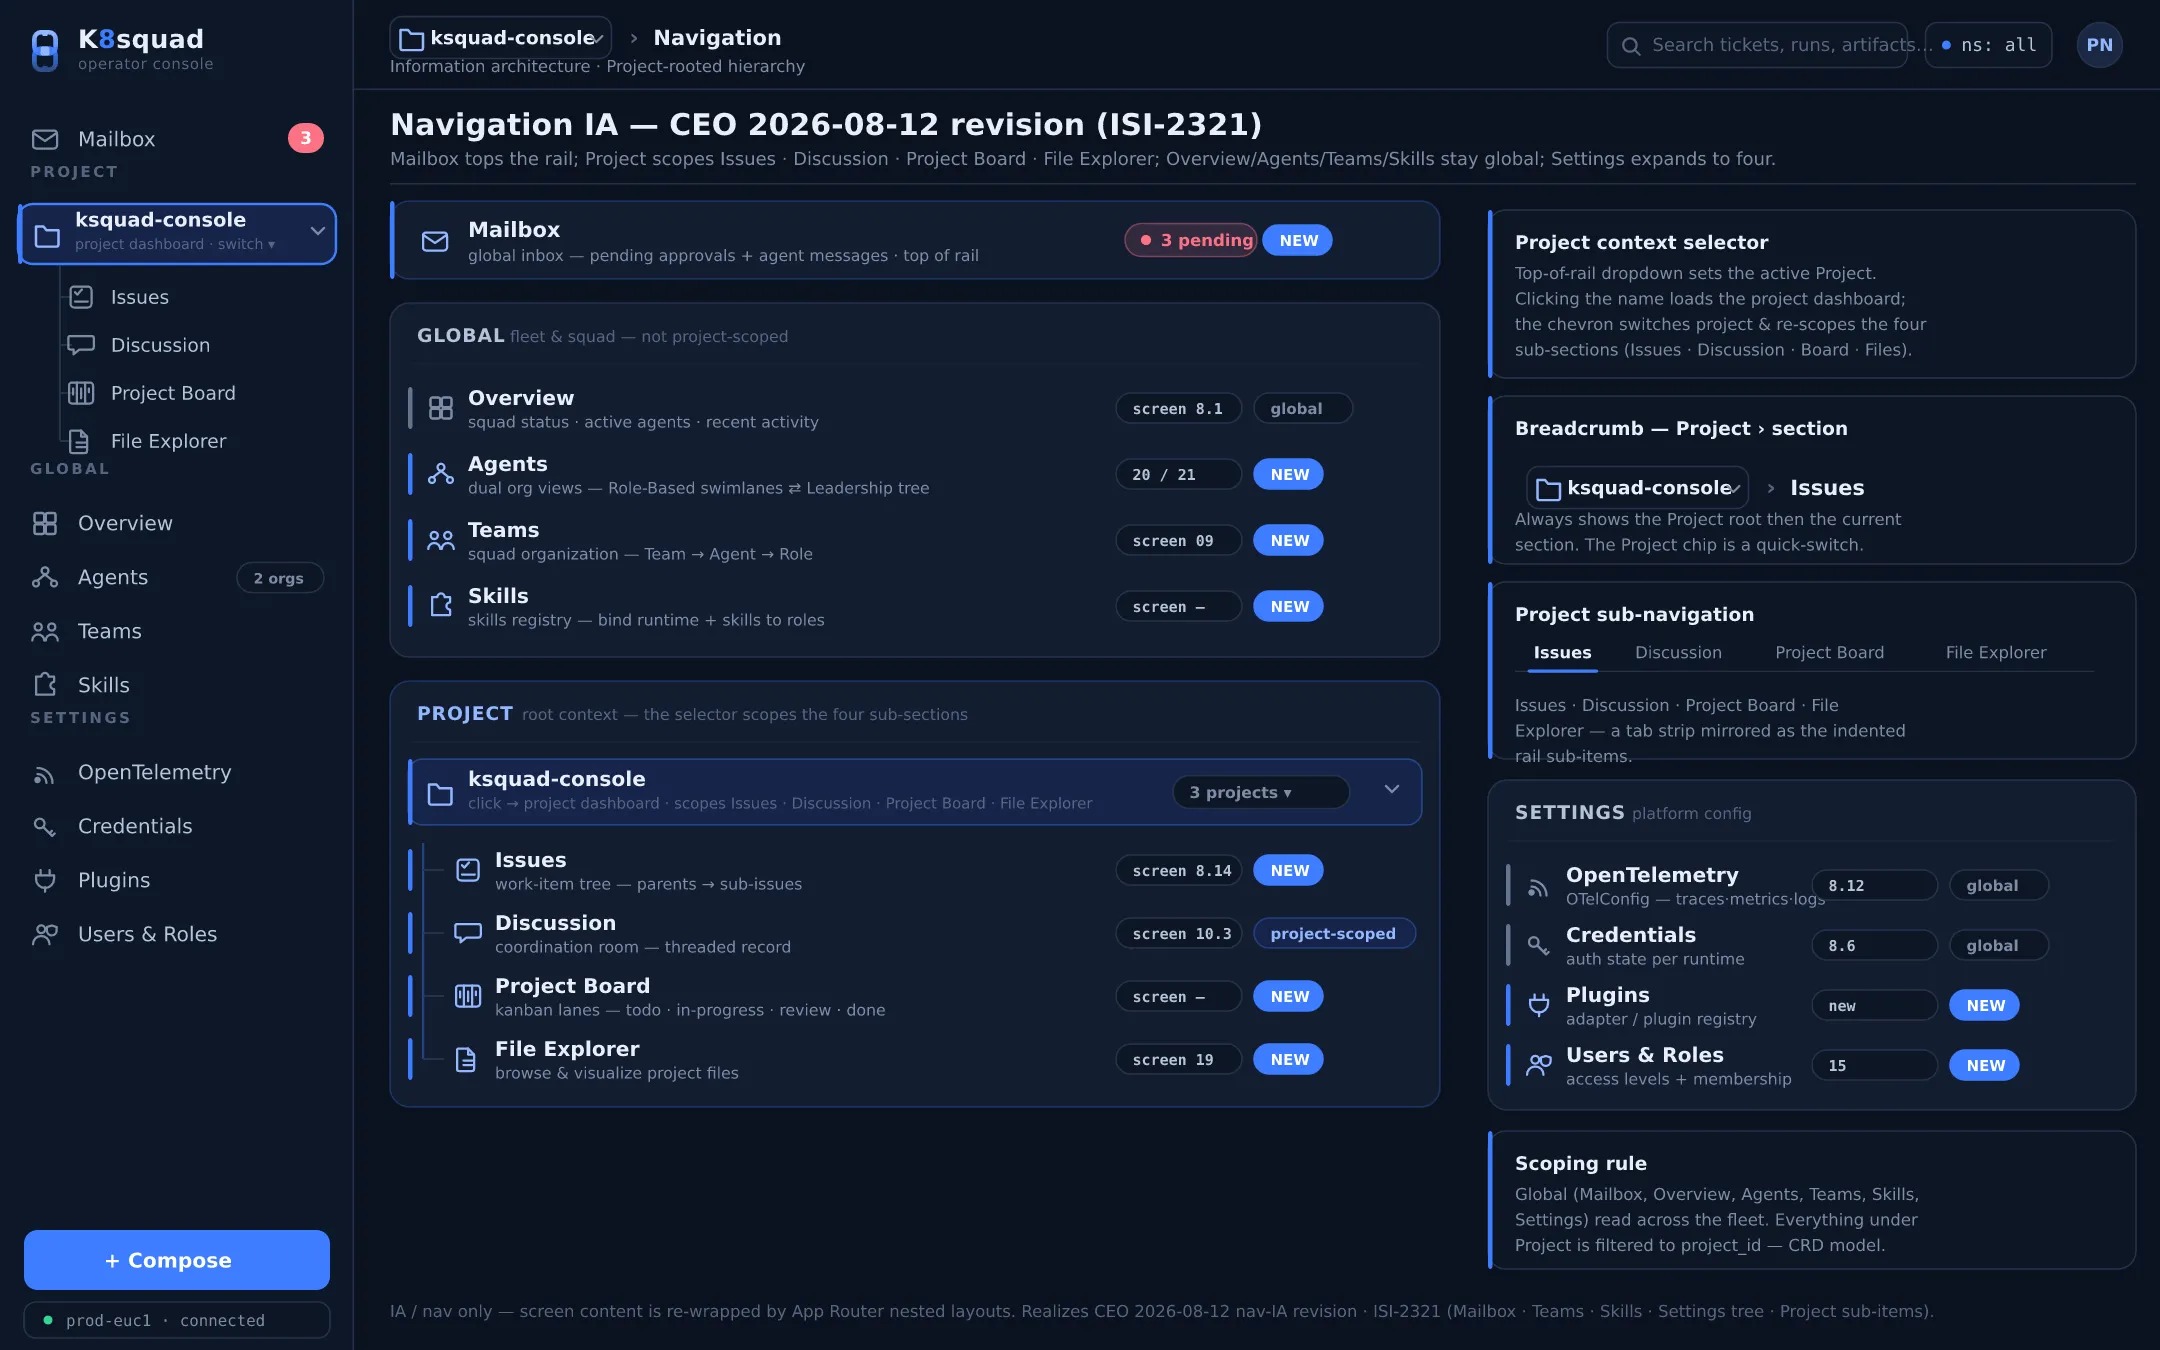
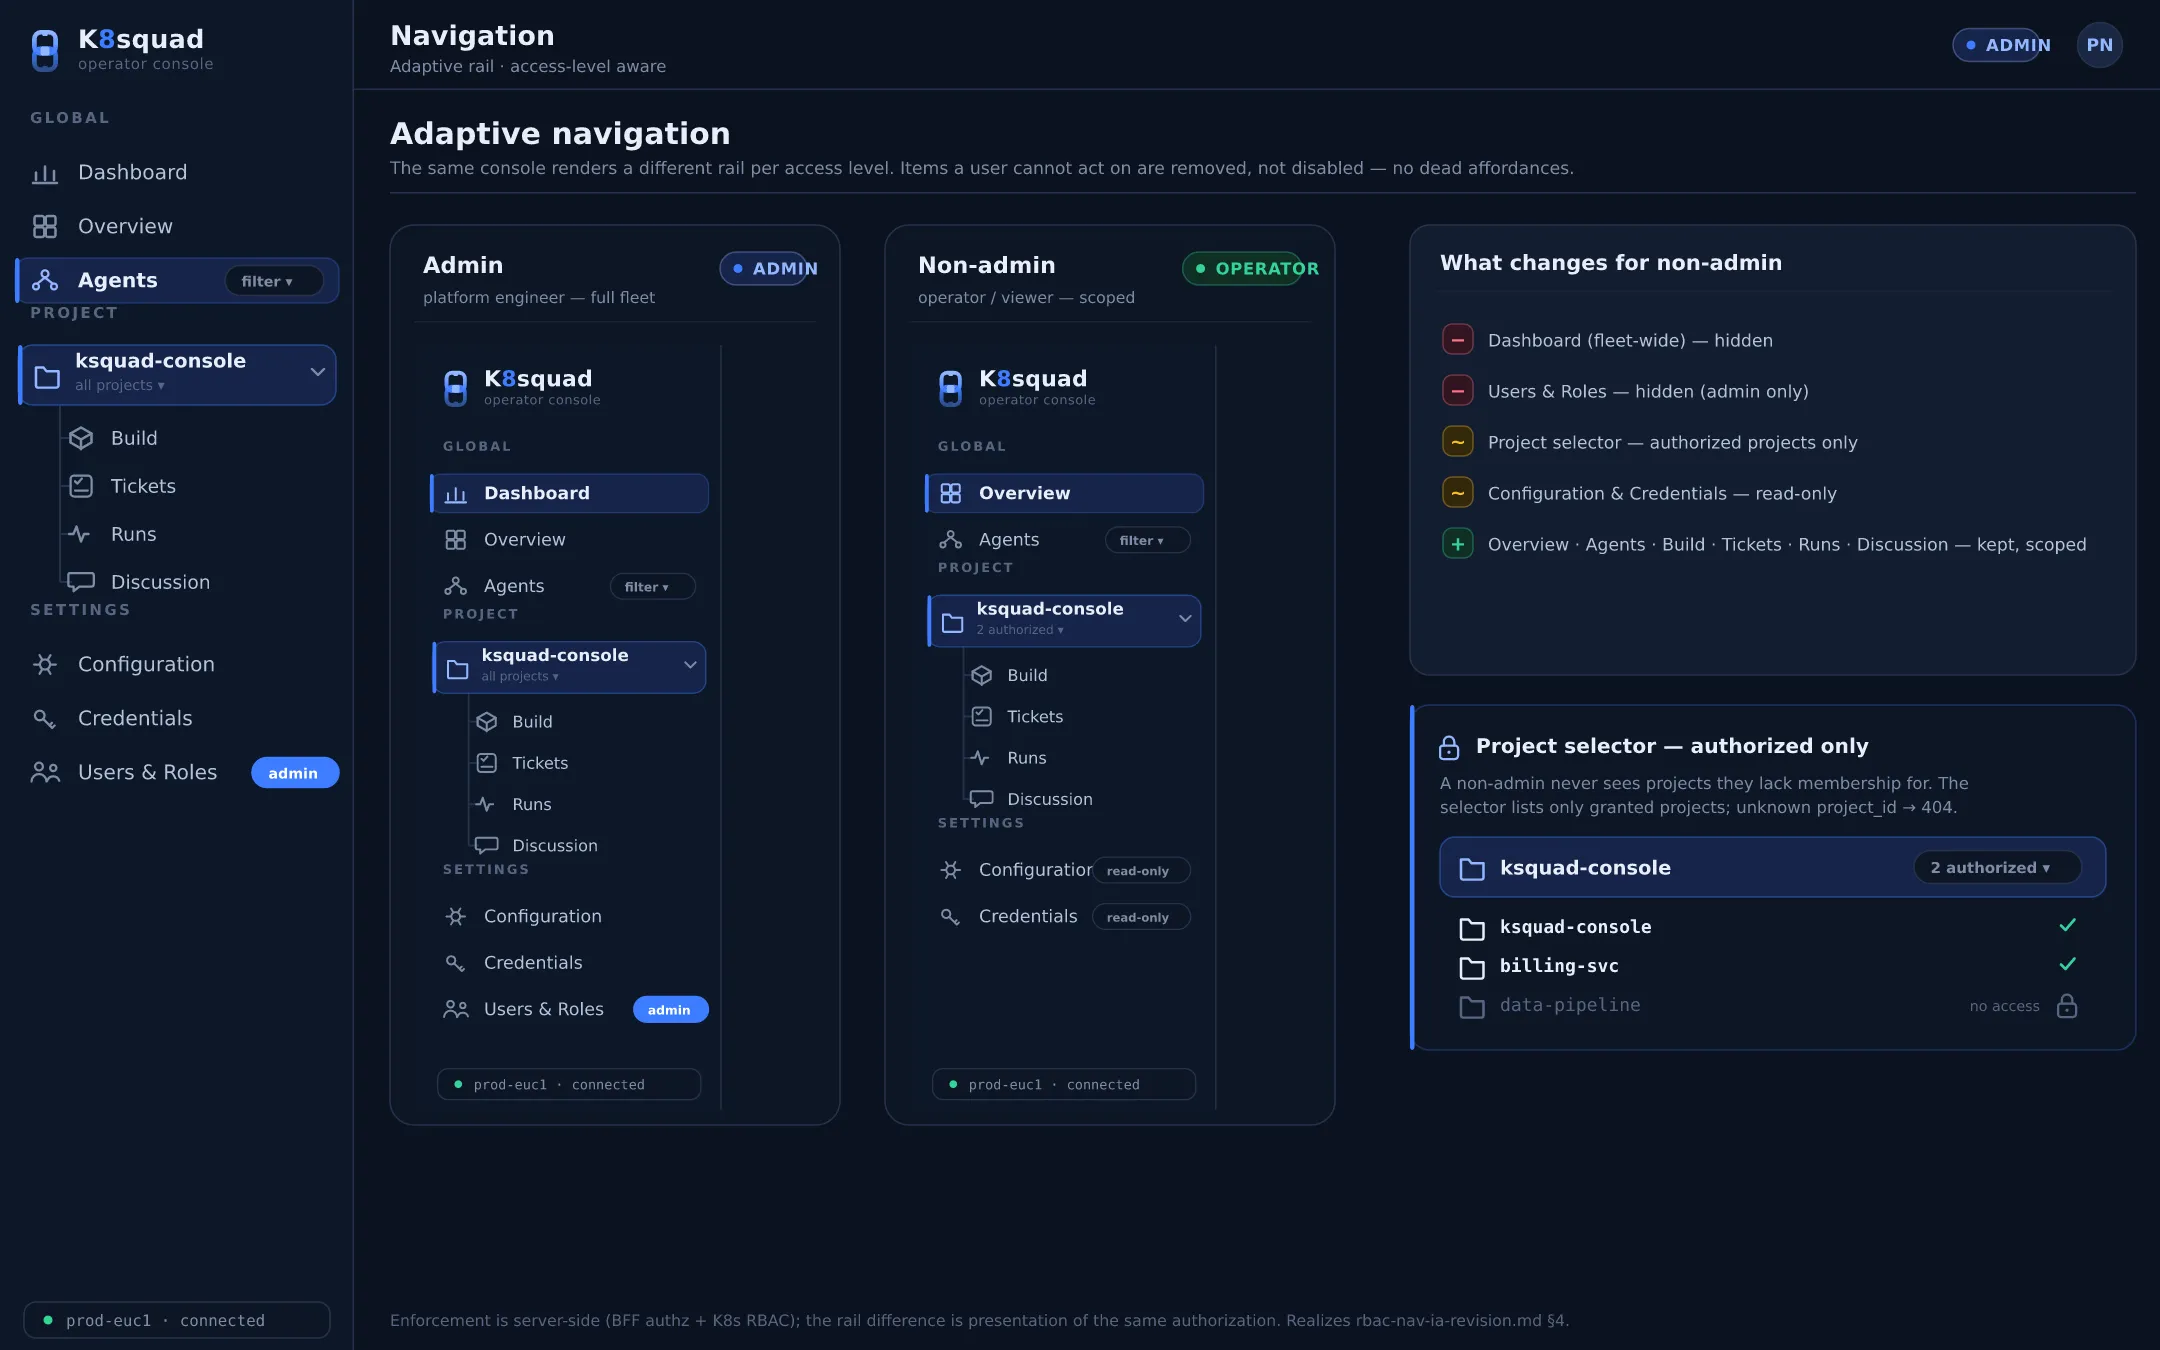
The console is organized around your squads and projects. A persistent global search in the top bar spans tickets, Runs, files, agents, and projects — and it’s RBAC-scoped, so results never exceed what you’re allowed to see. The nav is responsive: a full rail on desktop, an icon rail on tablet, and a bottom-nav + drawer on mobile.
Fleet dashboard
Section titled “Fleet dashboard”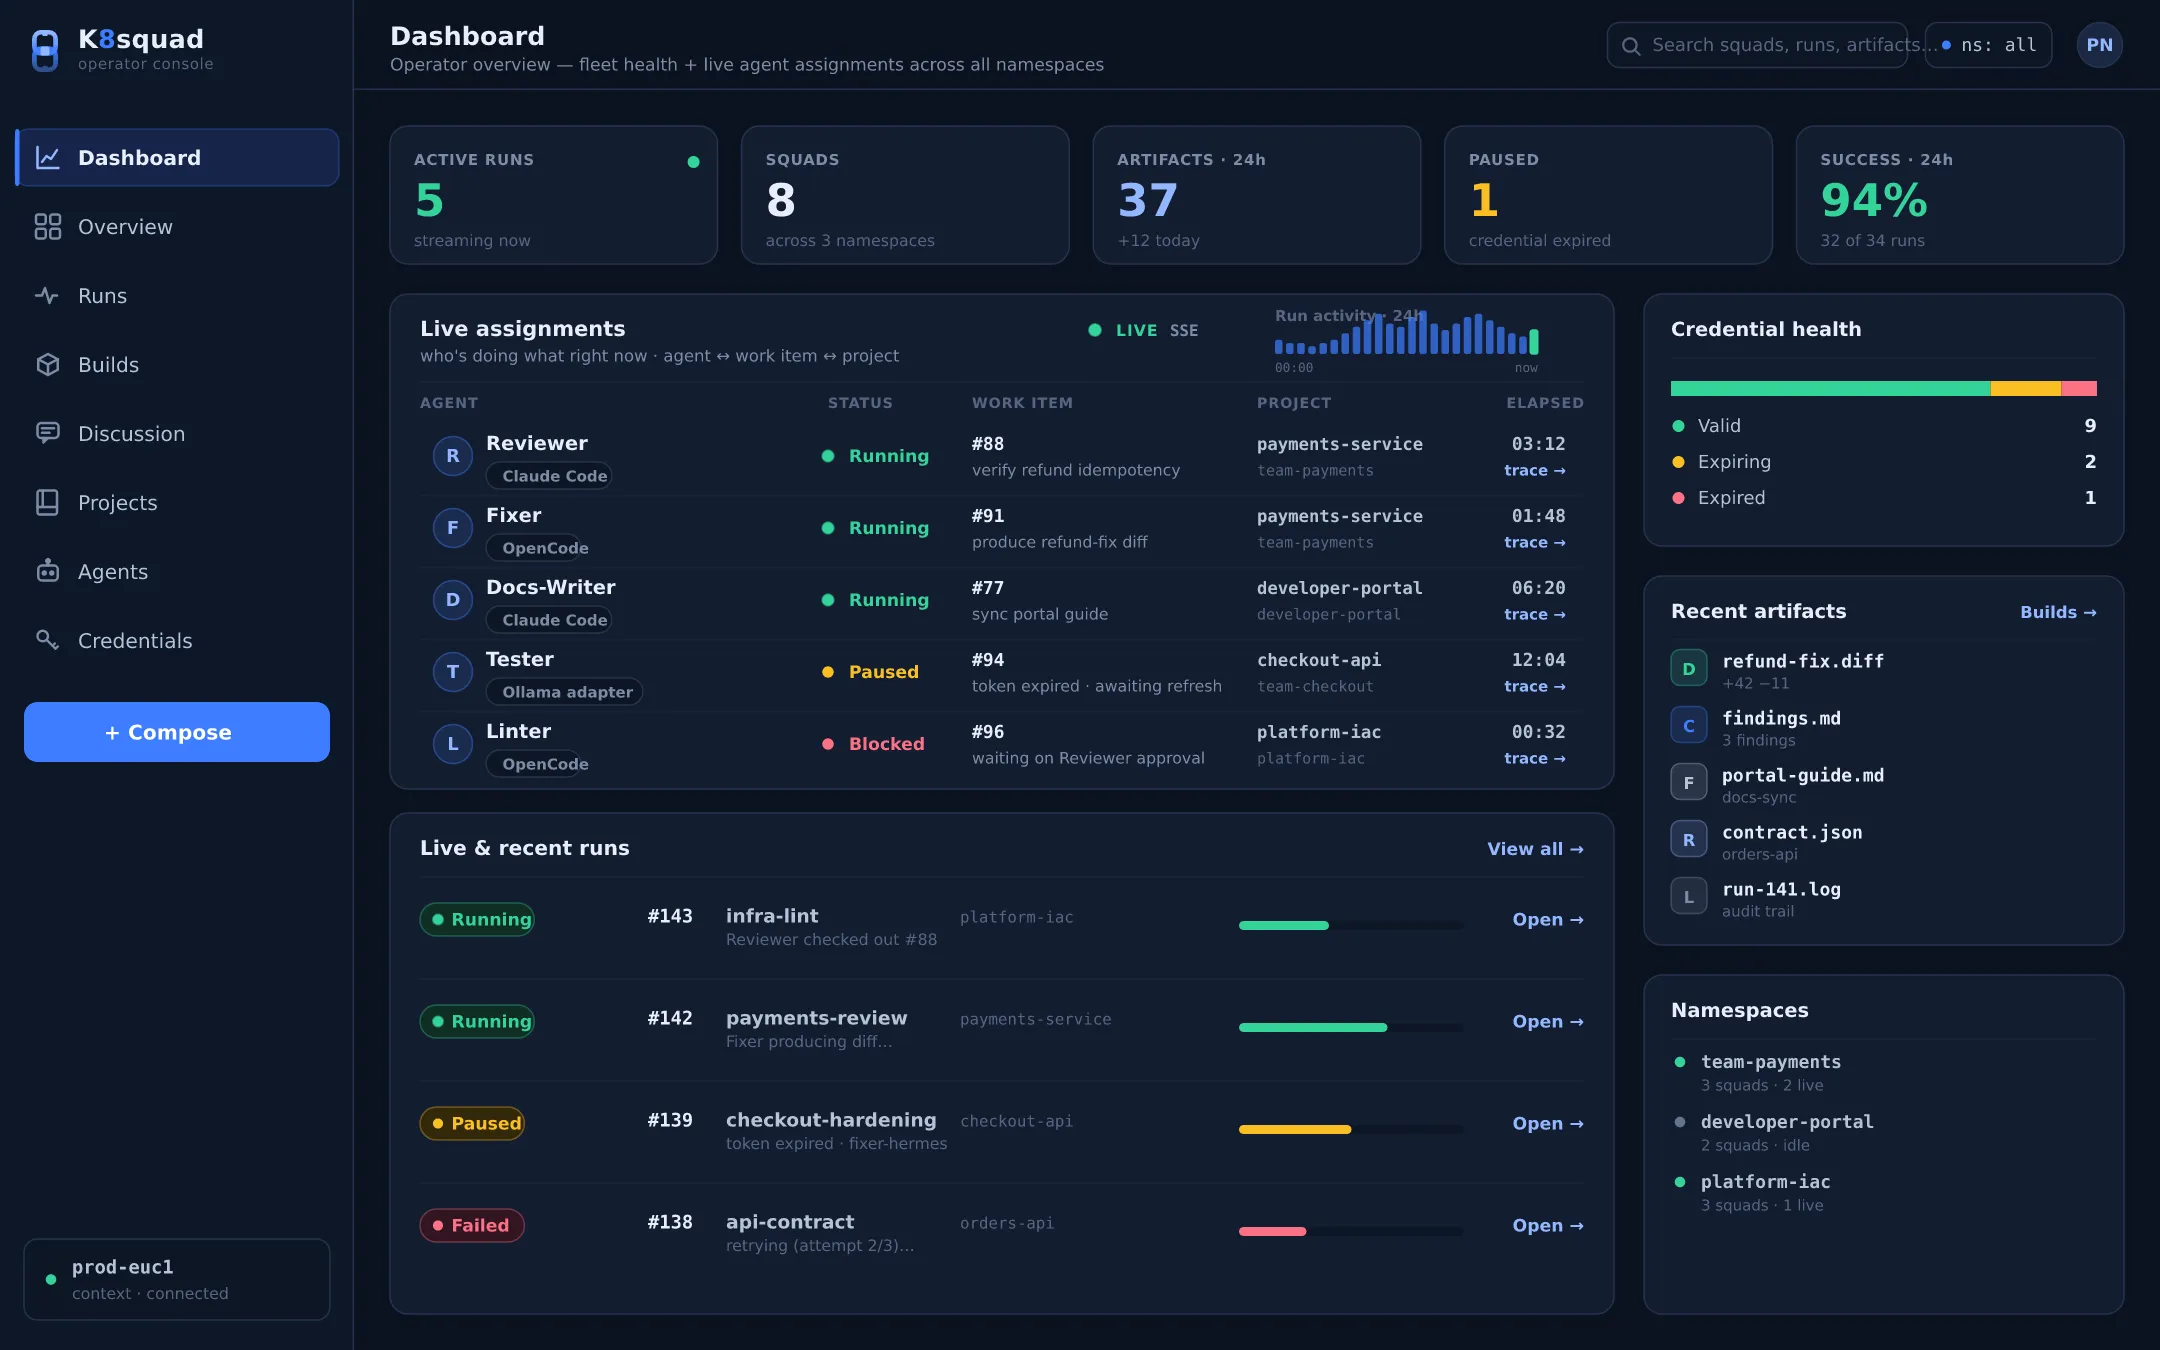
The fleet dashboard is your home base: every squad, live Run activity, and health across the whole deployment. It’s where an operator starts the day and where incidents surface first.
Squad overview
Section titled “Squad overview”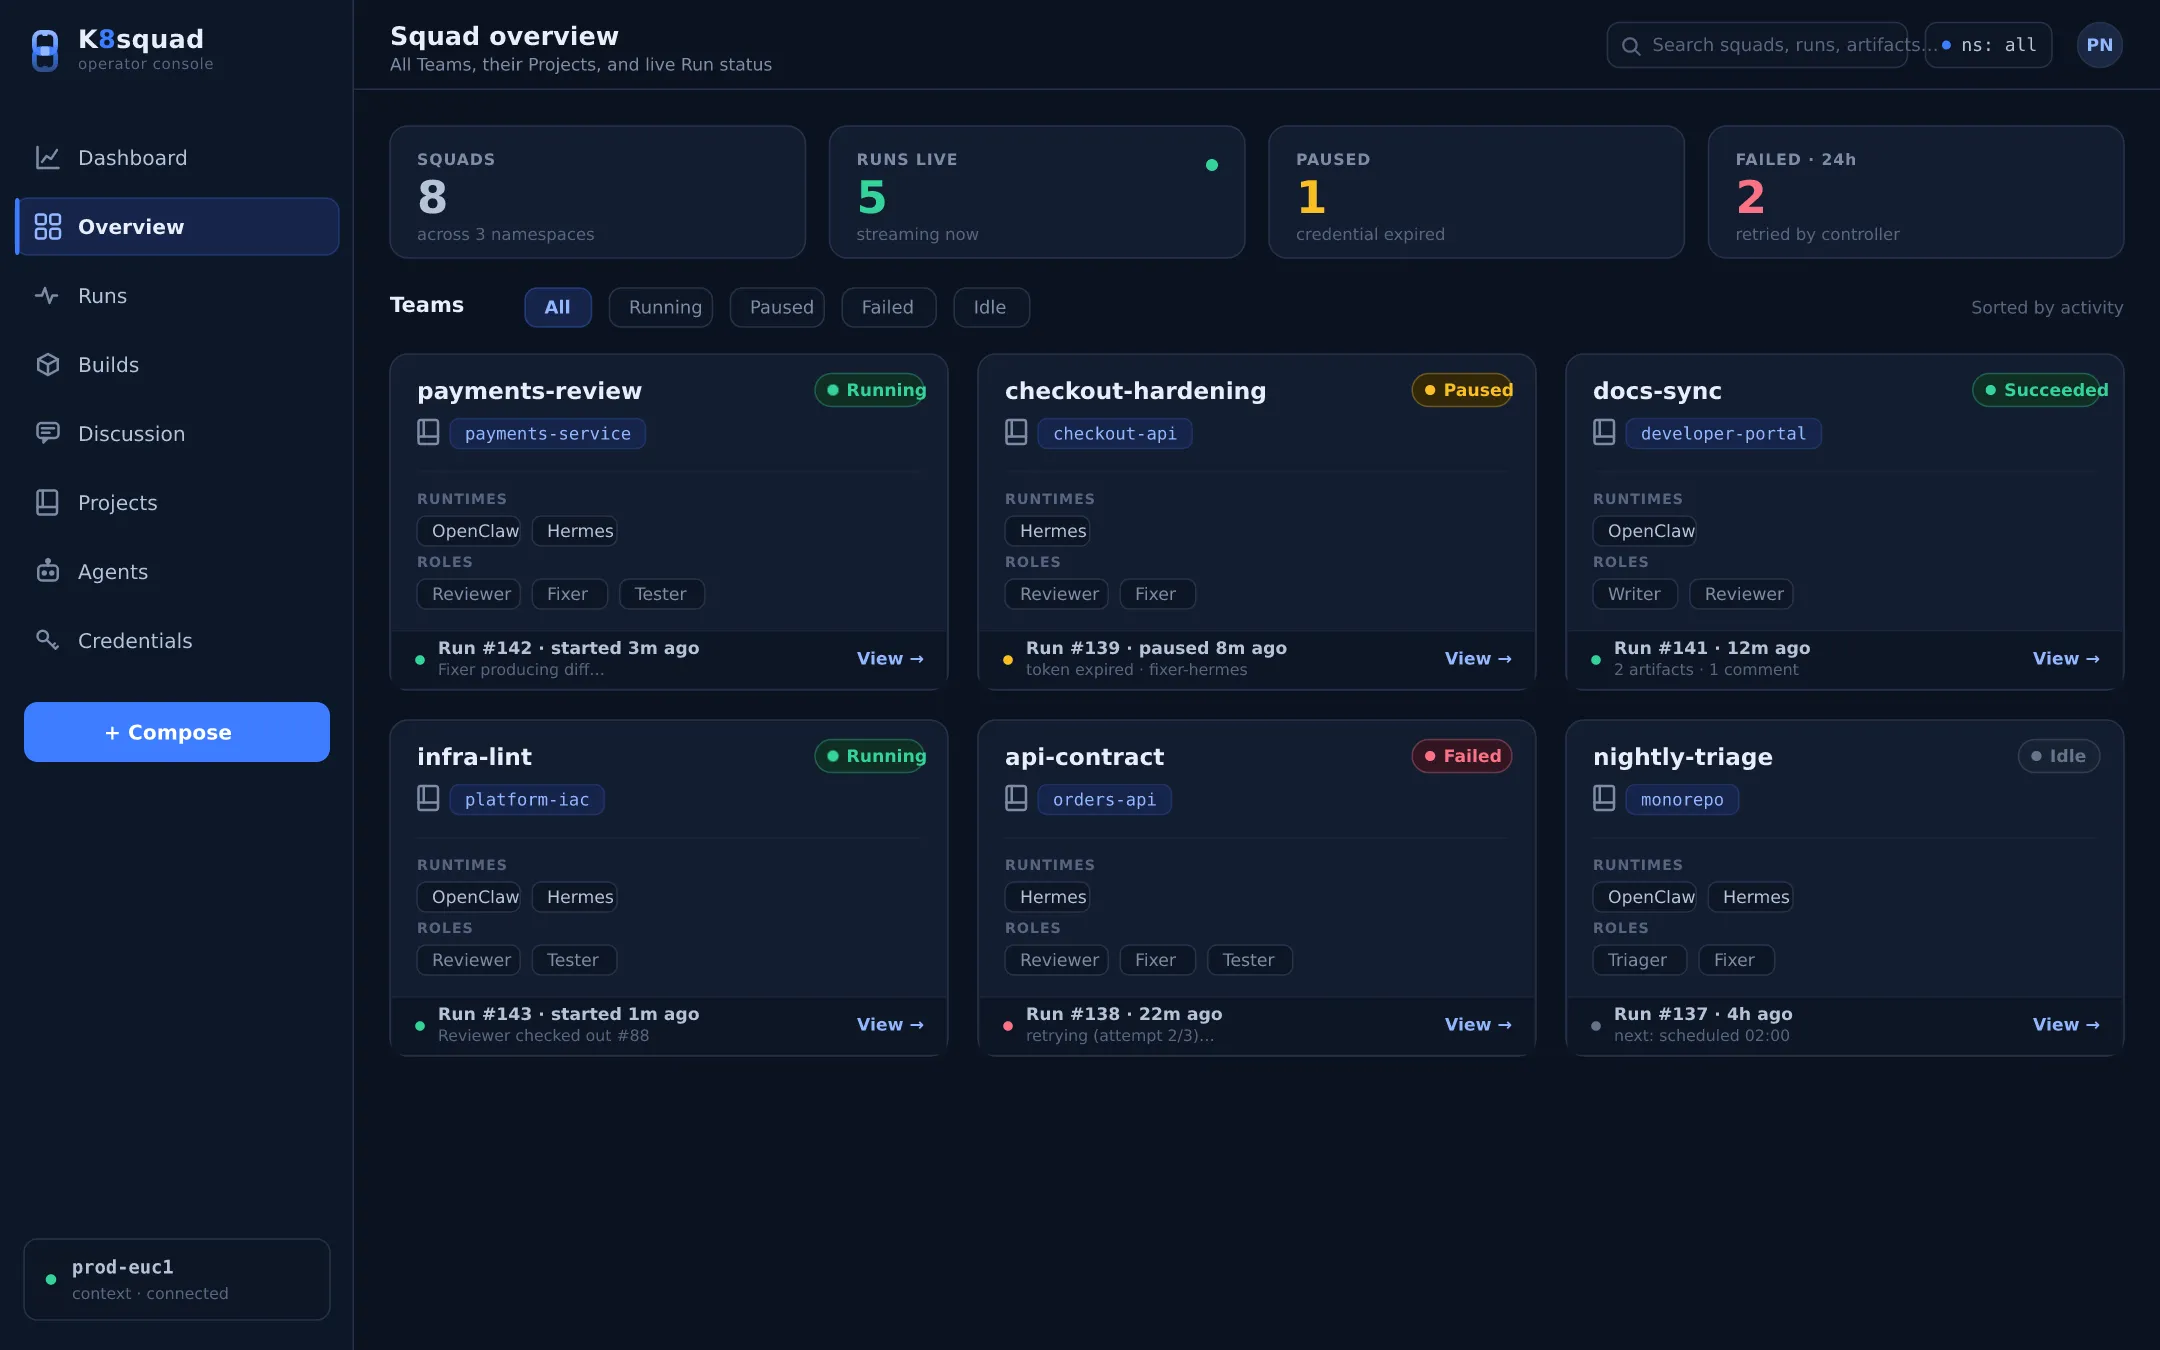
Drill into a squad to see its agents, the projects it owns, and current activity. From here you compose the squad, start Runs, and jump into any agent or project.
Watching a Run (live SSE stream)
Section titled “Watching a Run (live SSE stream)”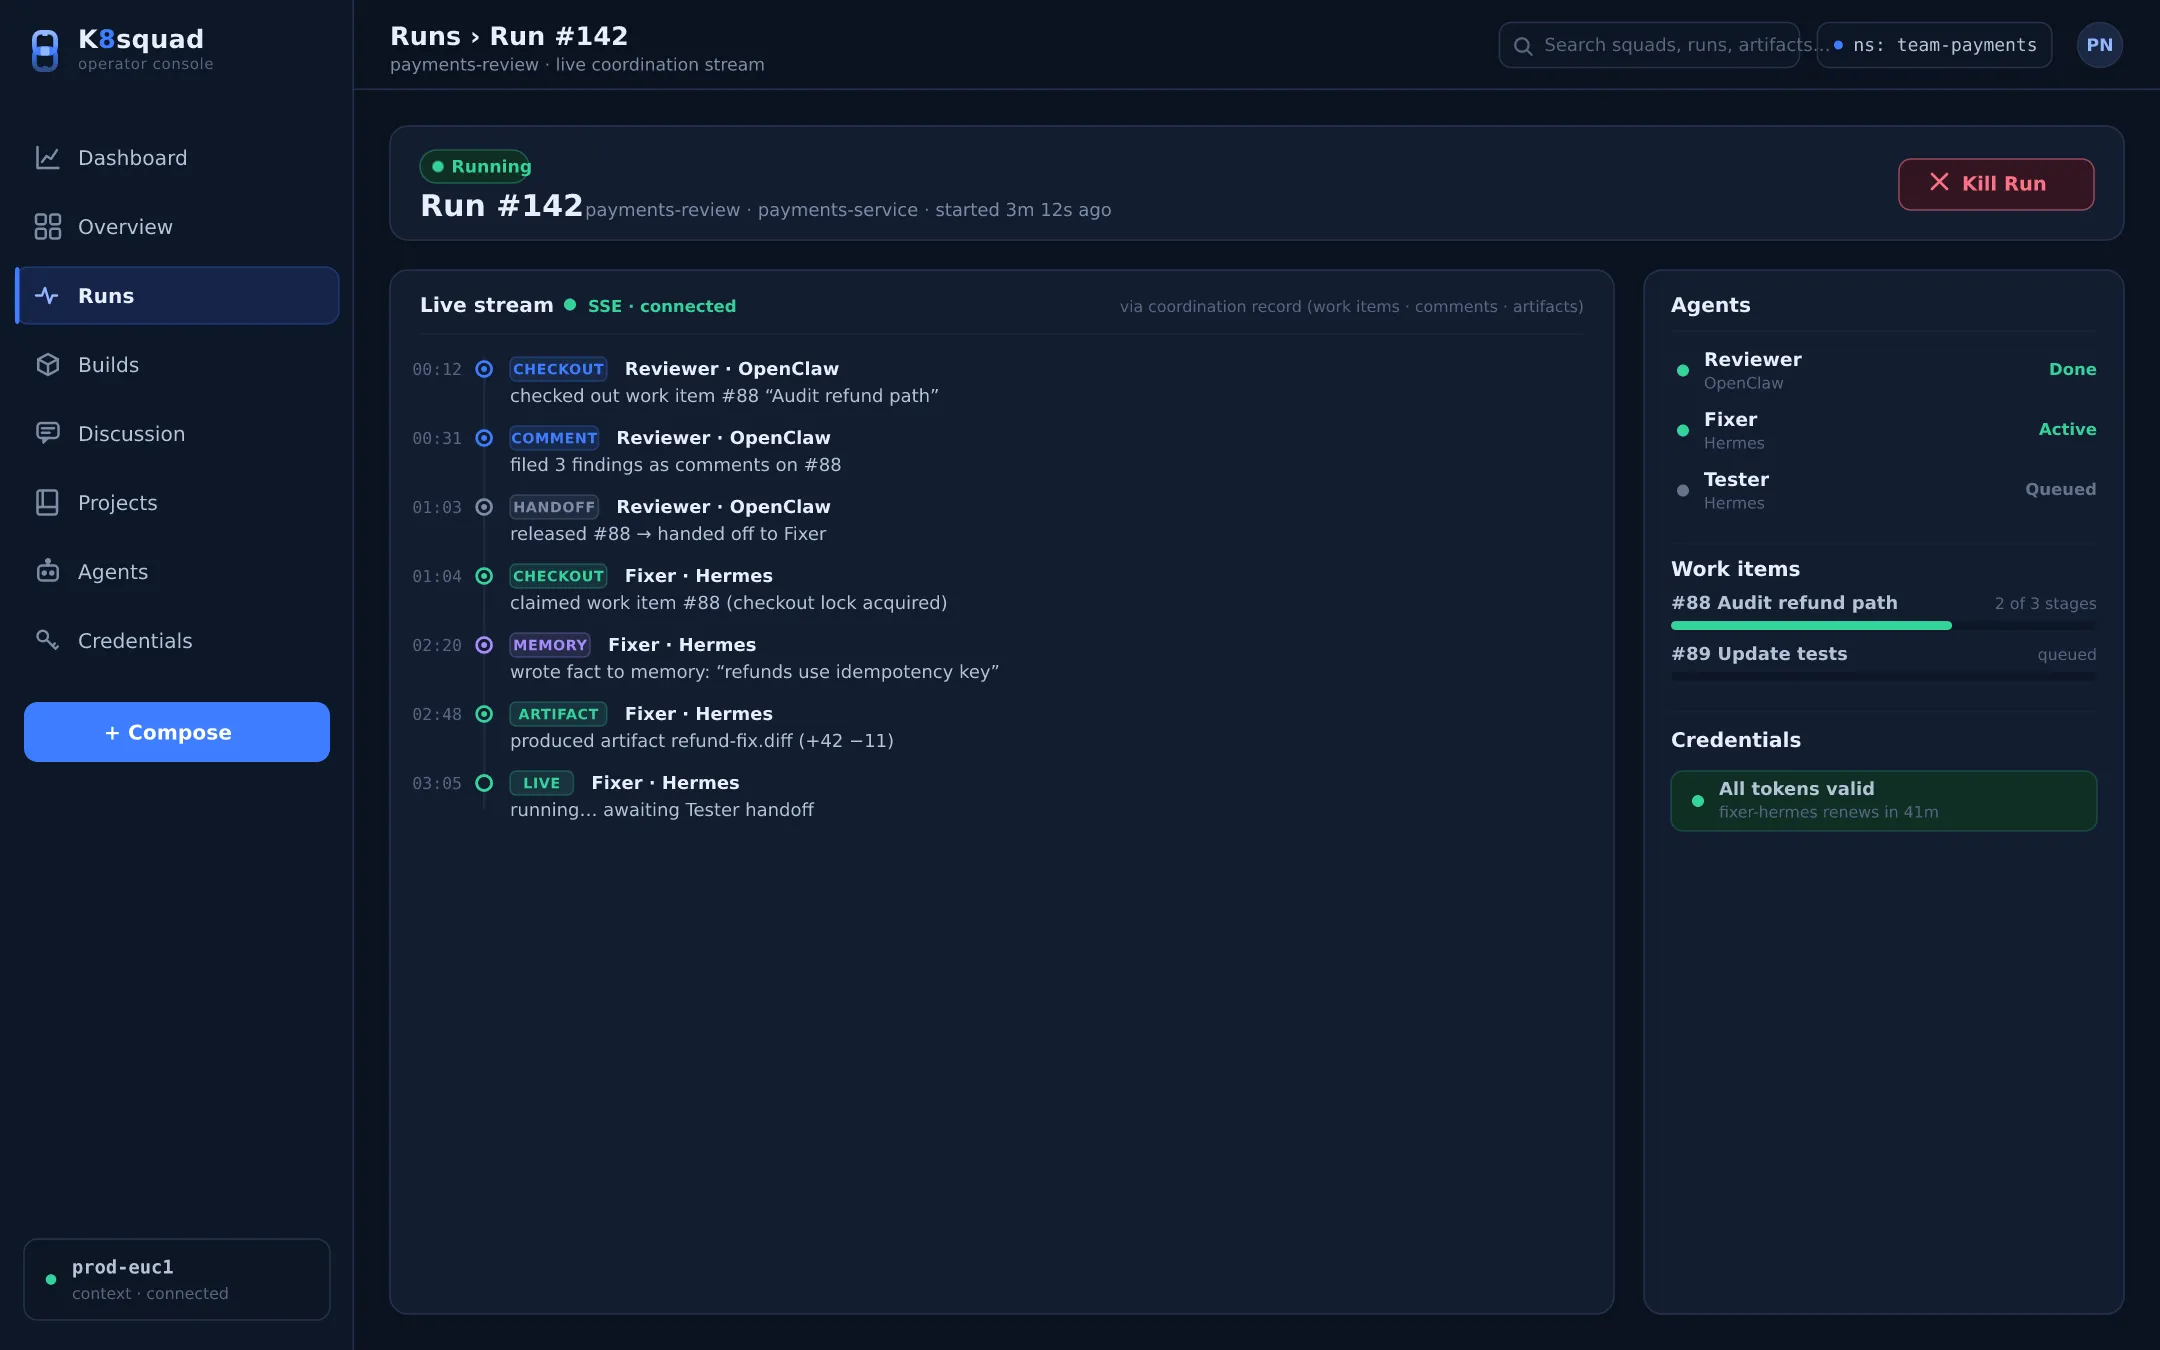
Open any Run to watch it stream live. Progress, tool calls, and status transitions arrive over SSE
in real time — no refresh. The Run’s phase (Pending → Claiming → Running → Succeeded/…) is always
visible, and a paused Run (credential or rate limit) shows a clear, legible reason rather than an
opaque failure.
Inspecting artifacts
Section titled “Inspecting artifacts”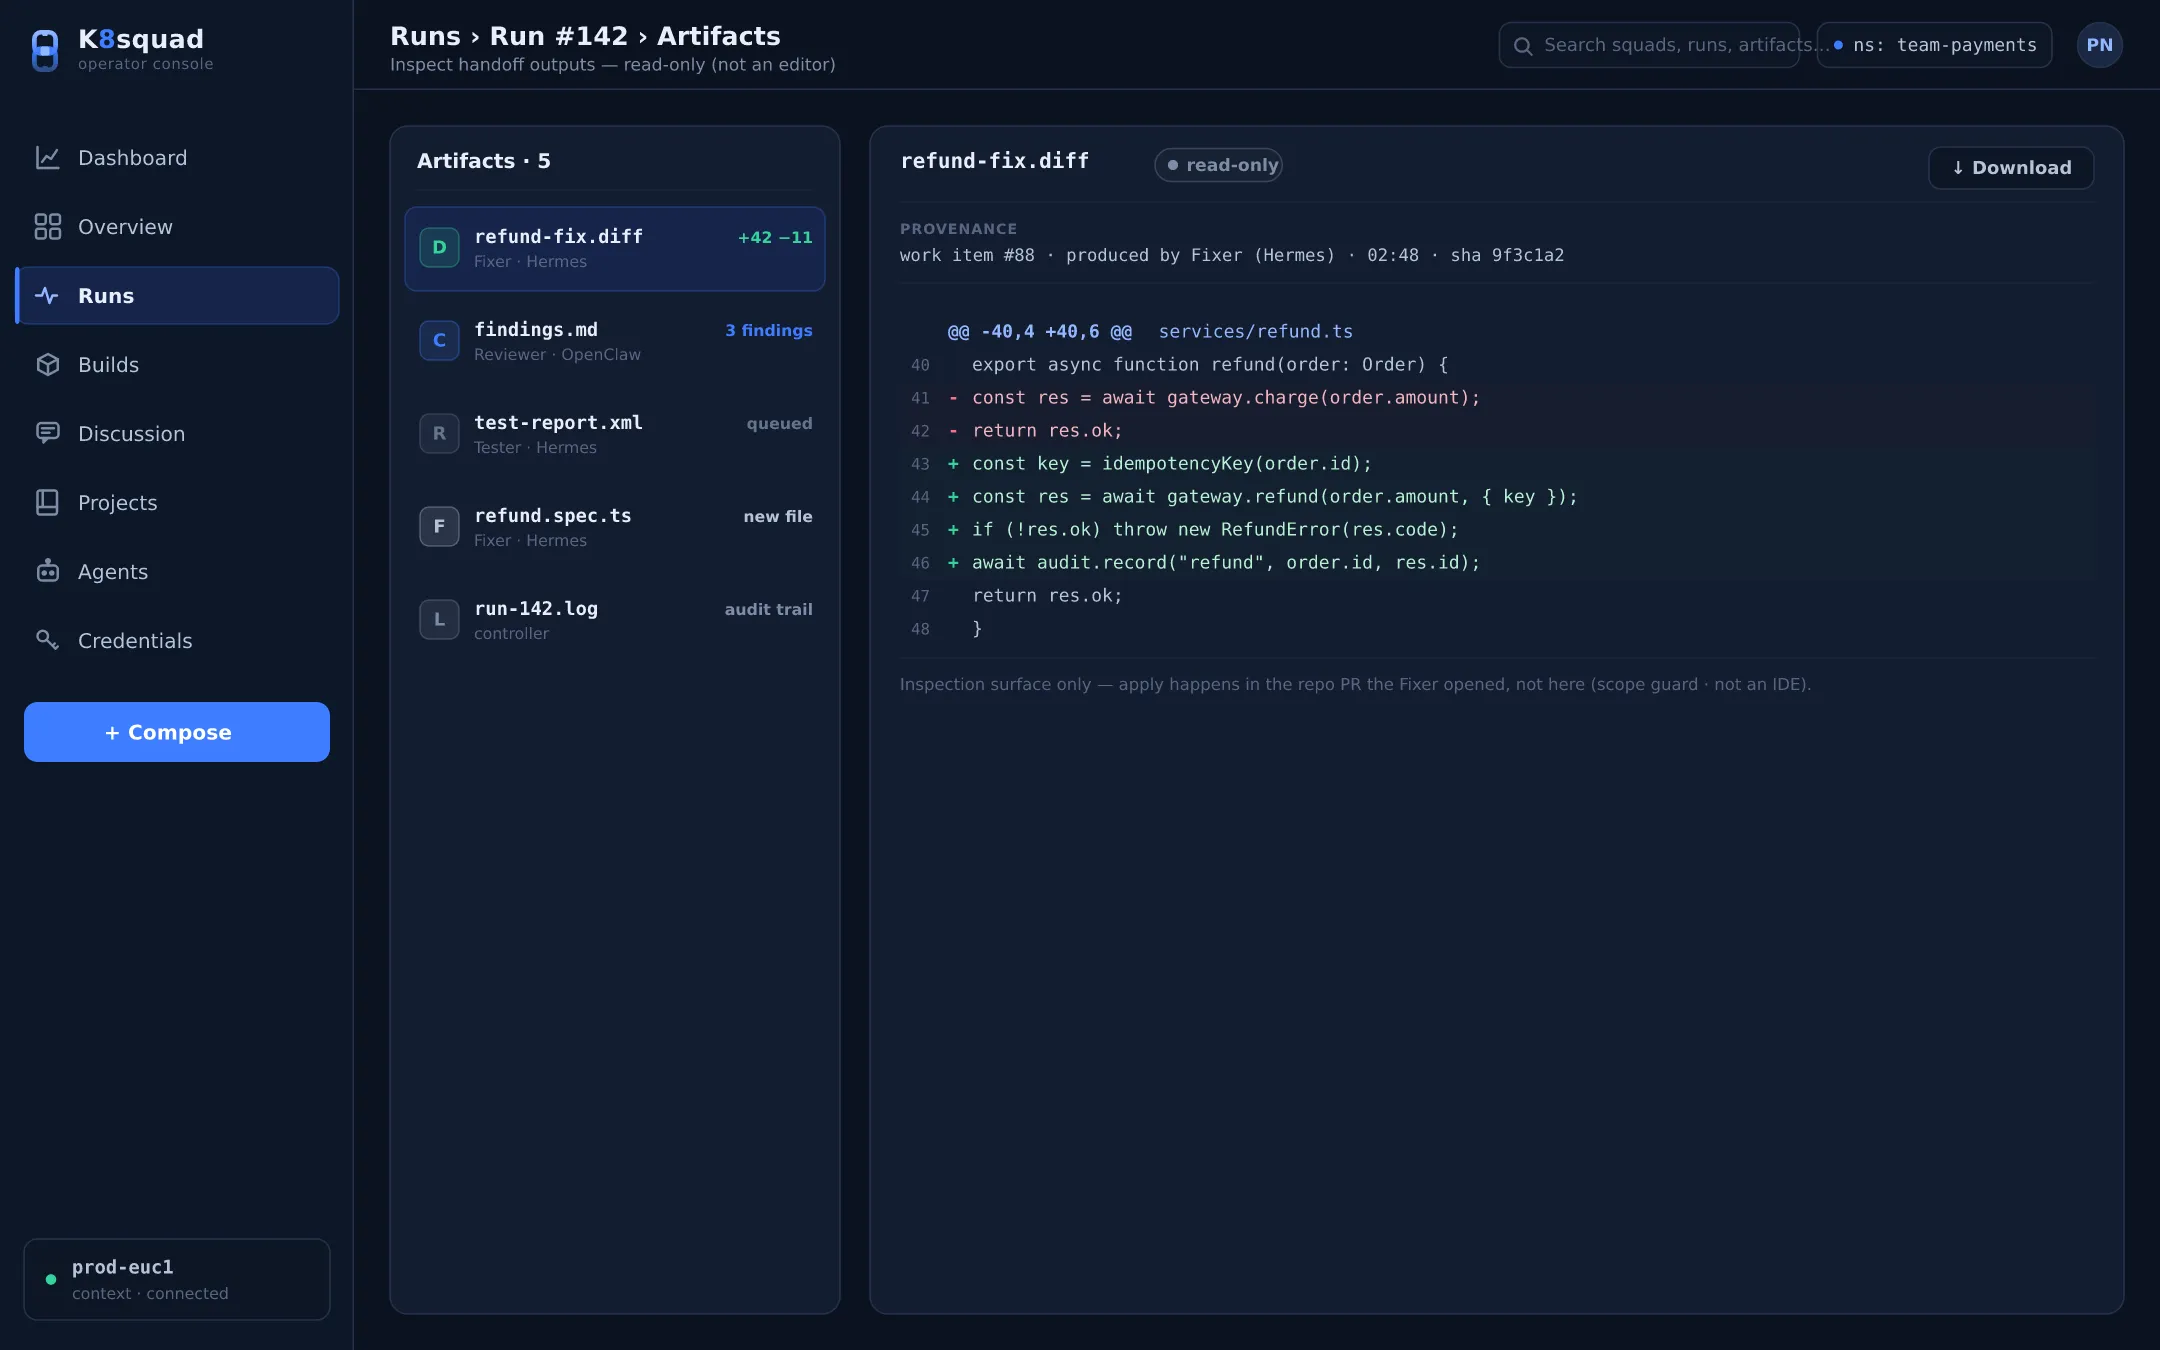
Every output a Run produces — diffs, logs, build blobs — is a first-class artifact tied to its work item. Inspect them here, with full provenance back to the Run and agent that produced them.
The build browser
Section titled “The build browser”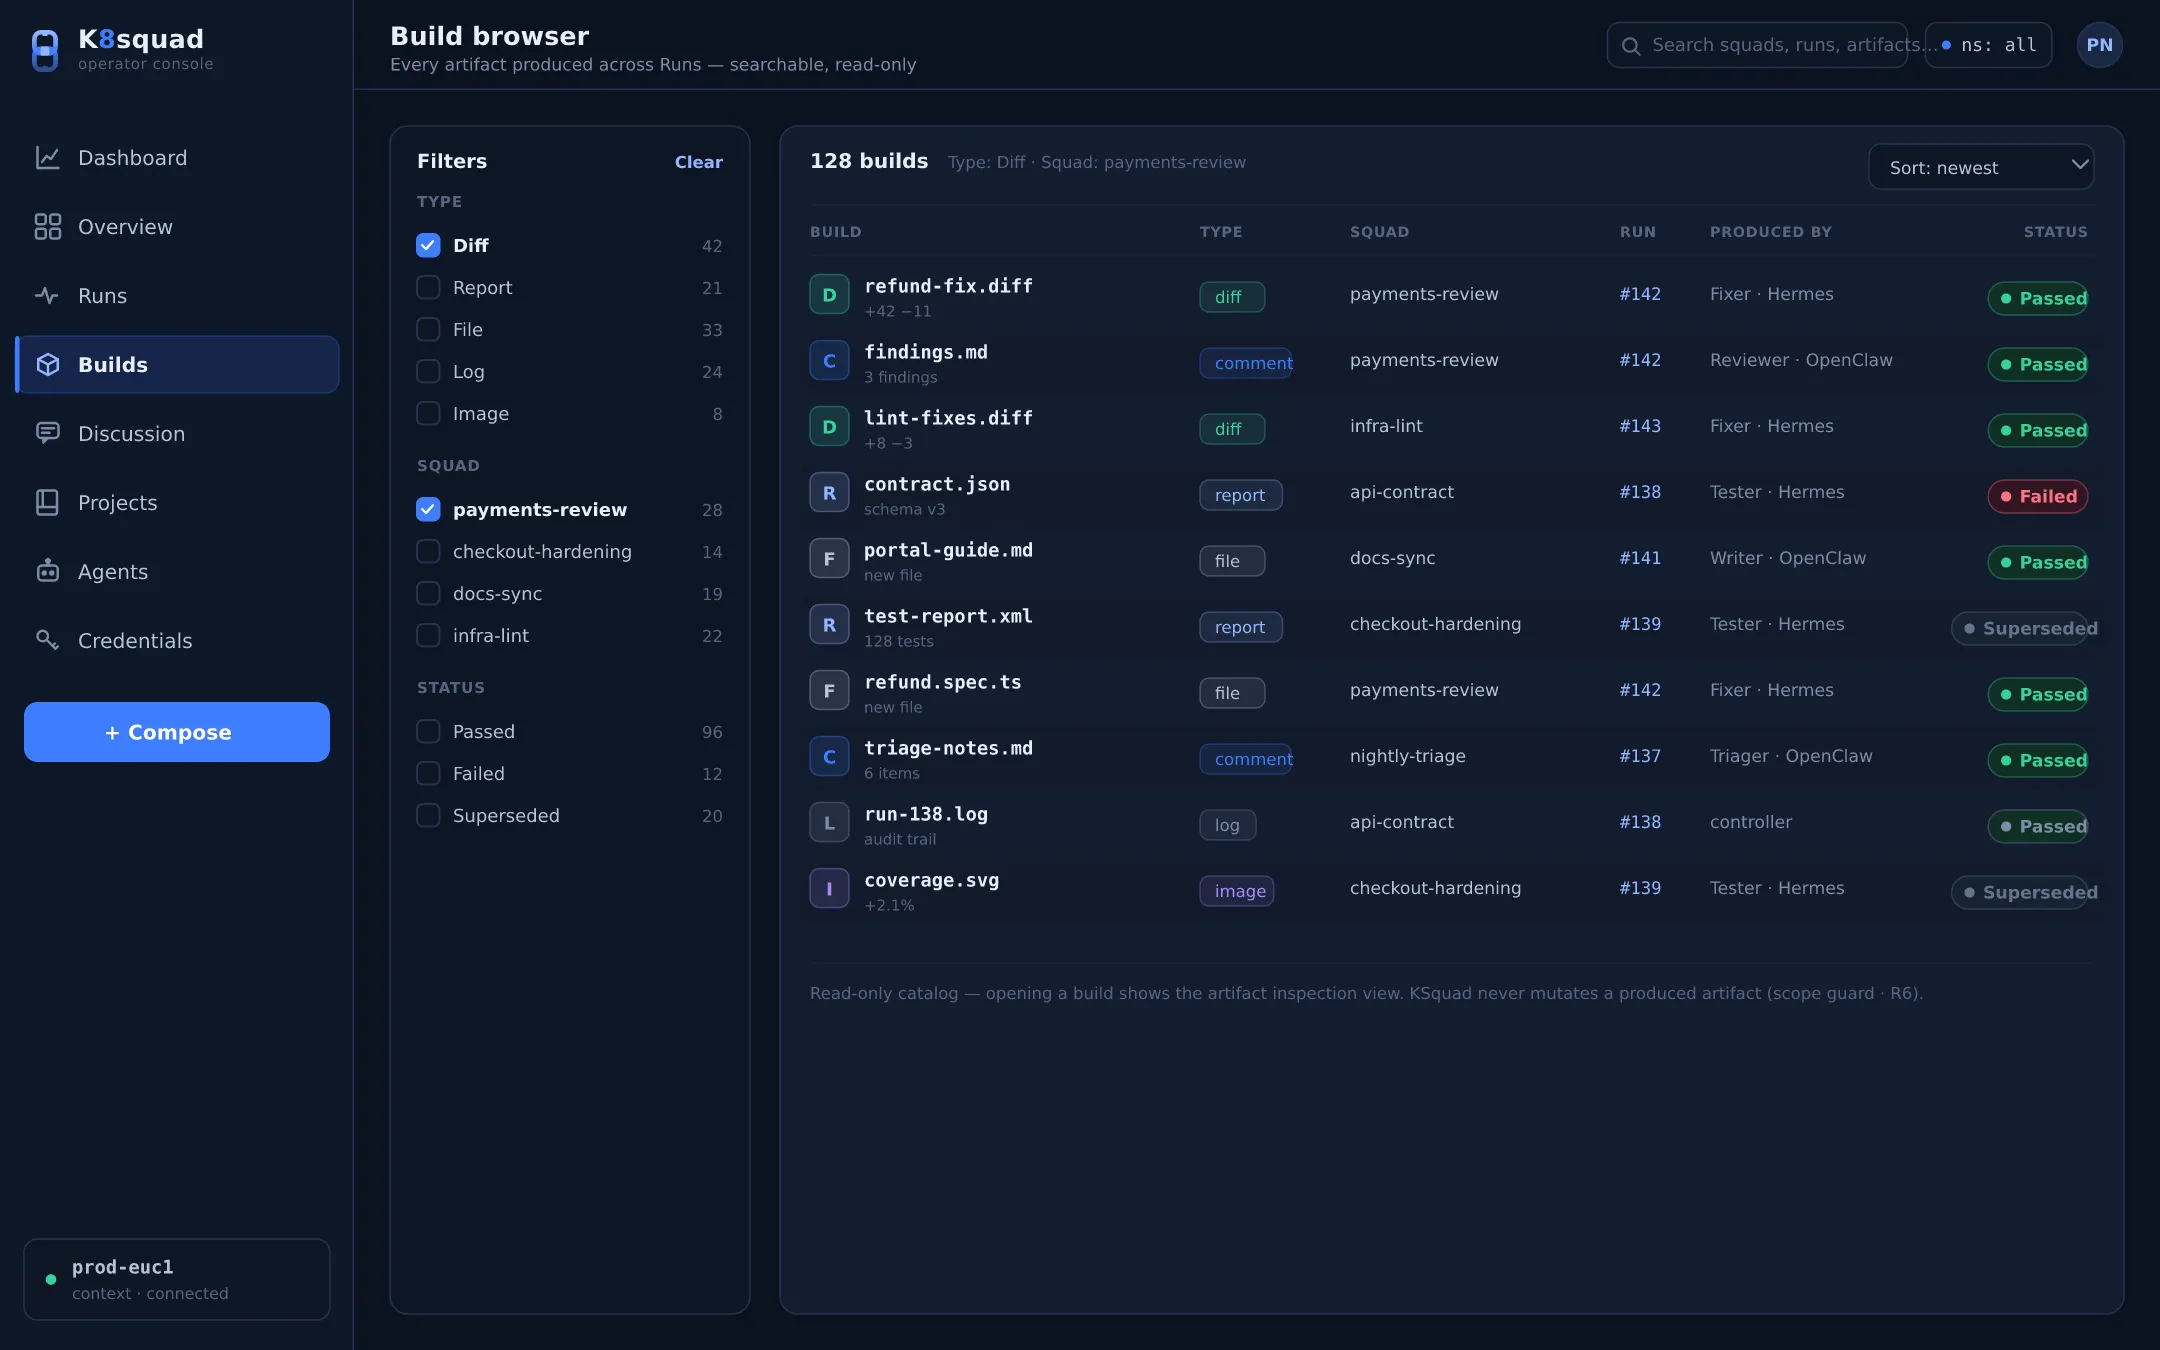
The build browser gives you a per-Run view of files, diffs, and code the squad produced — a read-only window into the work, so you can review what an agent did without cloning anything.
Project dashboard
Section titled “Project dashboard”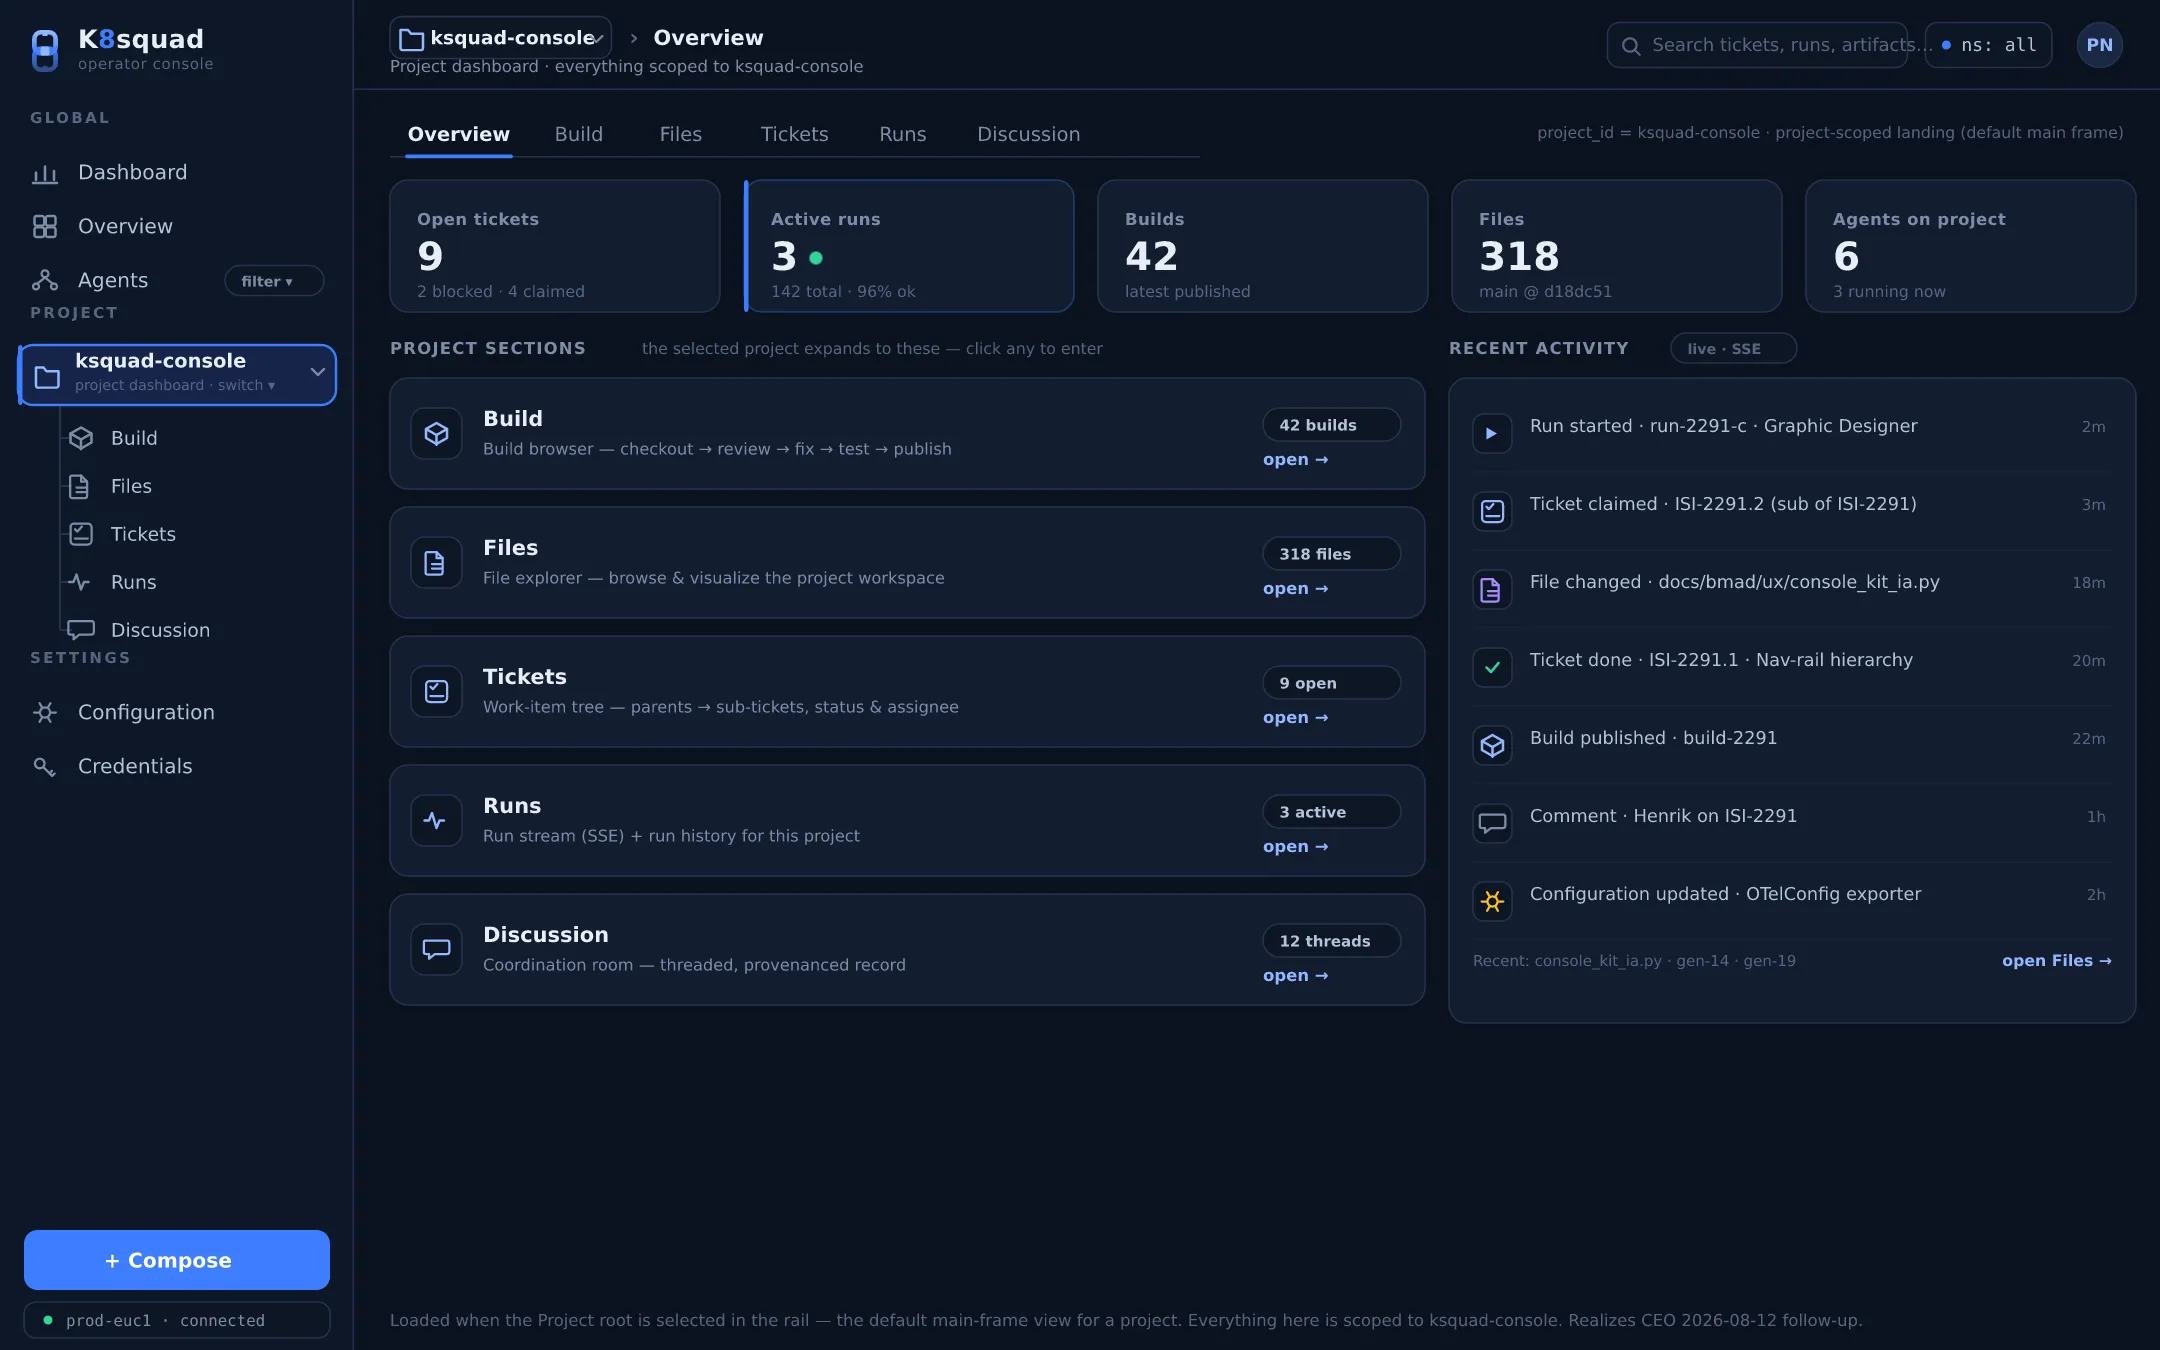
Each project has its own operational dashboard: tickets by status, token consumption and its trend, PR status, live Runs, pending approvals, and quick links to Issues, Files, Board, and Discussion. It’s an operational view over KSquad’s own entities — not a general BI tool — and everything on it is sourced from real signals, never placeholders.
Pending approvals live here too: when a Run raises a human-in-the-loop gate, an authorized
maintainer or admin approves or rejects it, and the decision is recorded durably.
Project tickets / board
Section titled “Project tickets / board”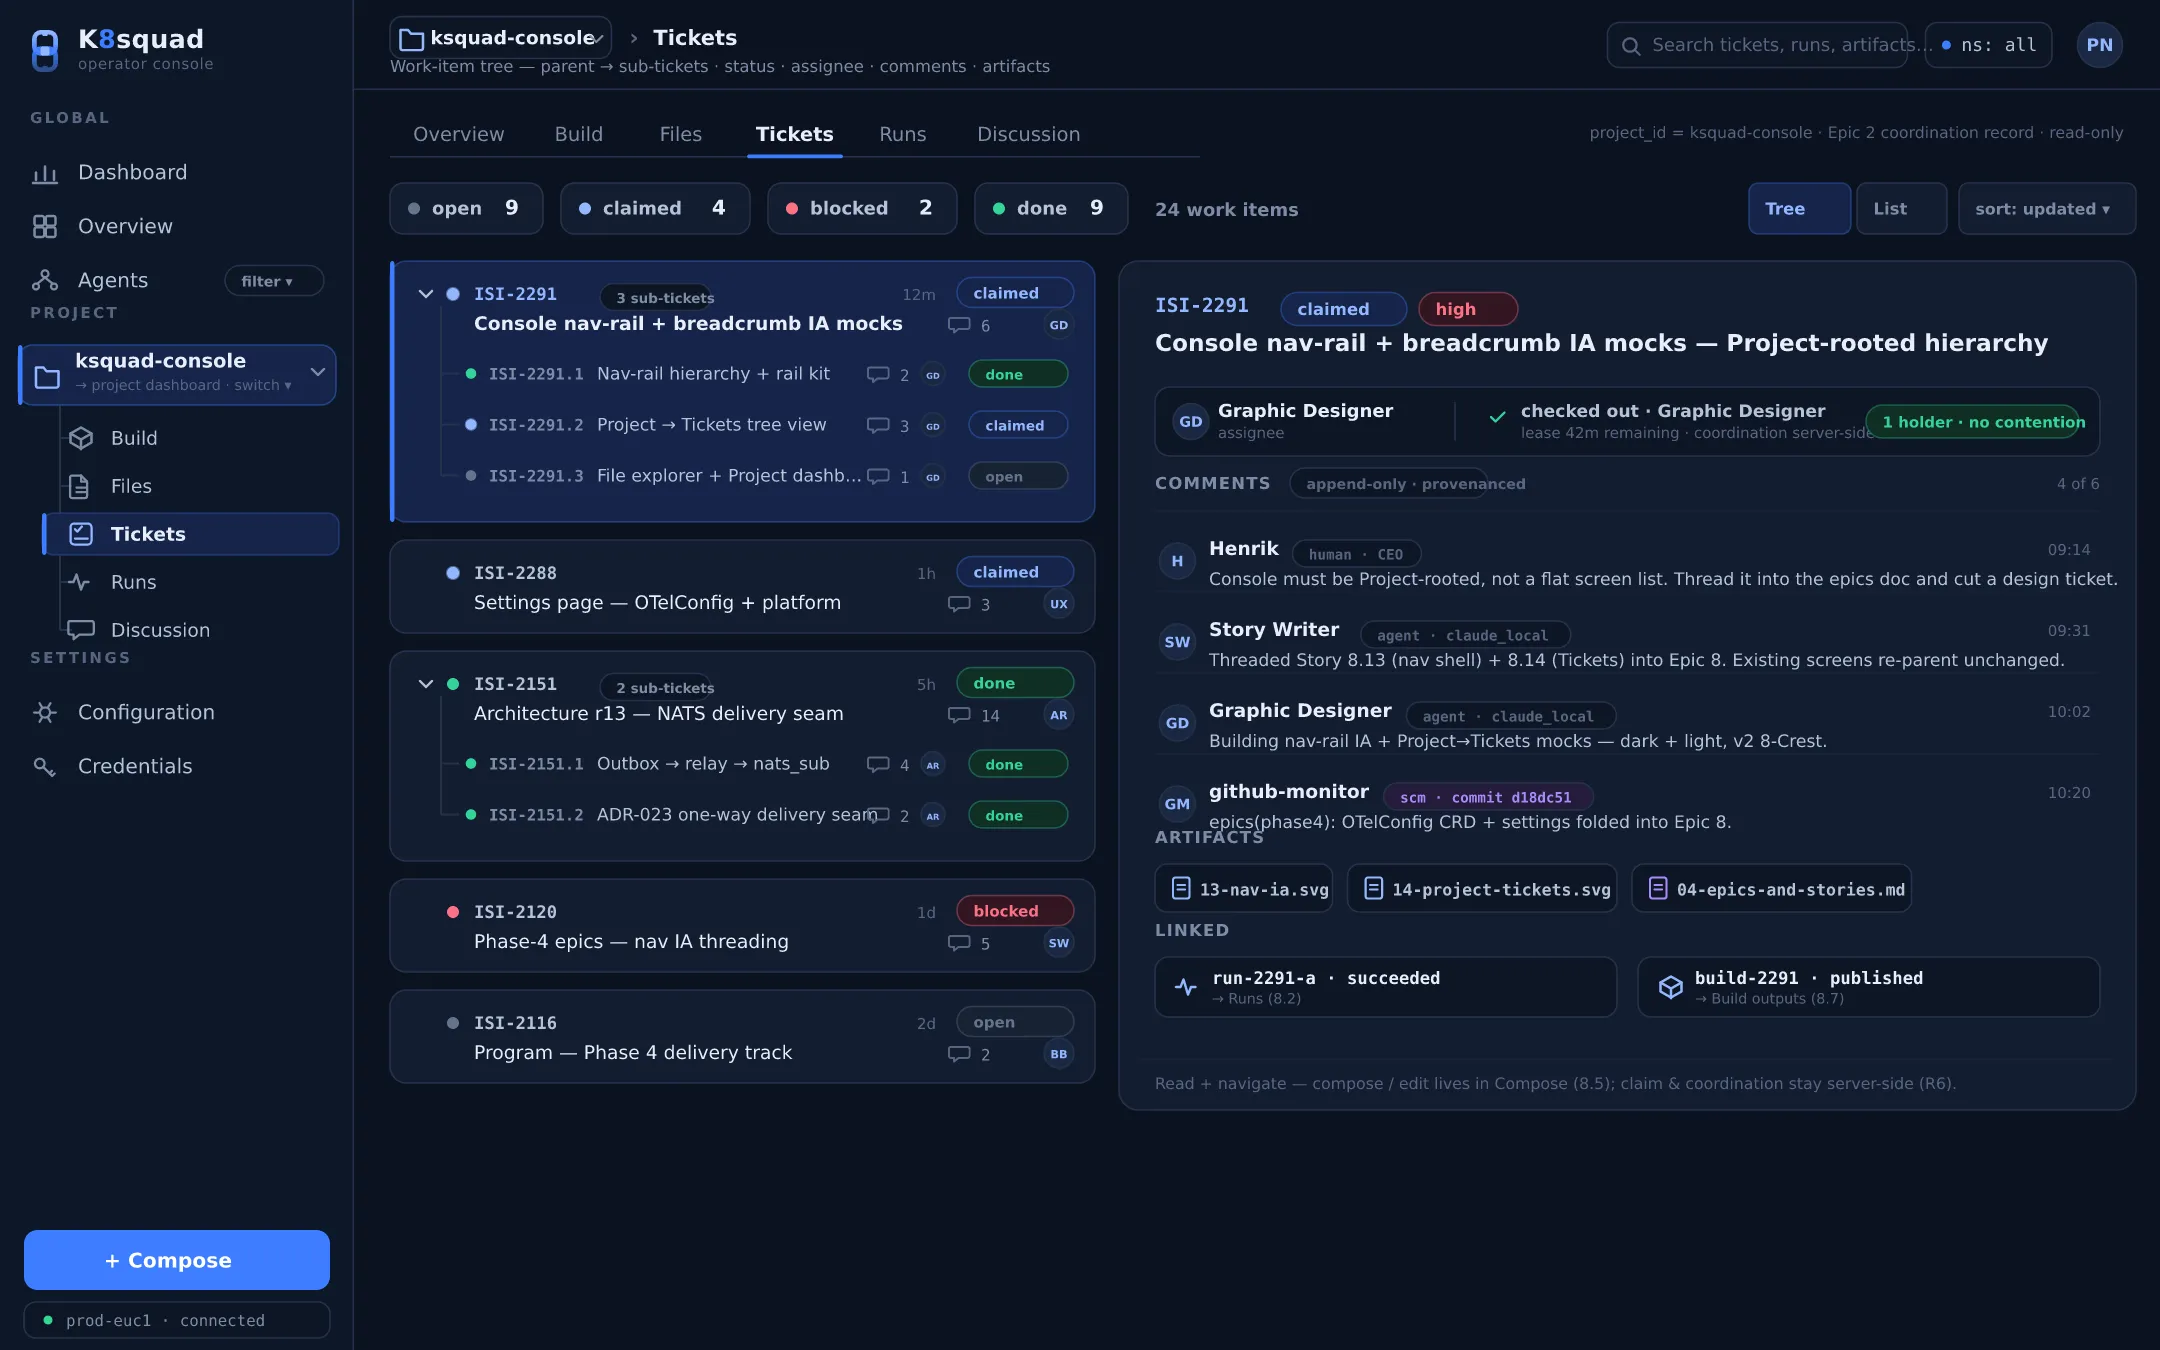
The board is the project’s work items — created in the console, synced from source control, or raised by agents. This is the human-facing view of the durable coordination record.
Discussion room
Section titled “Discussion room”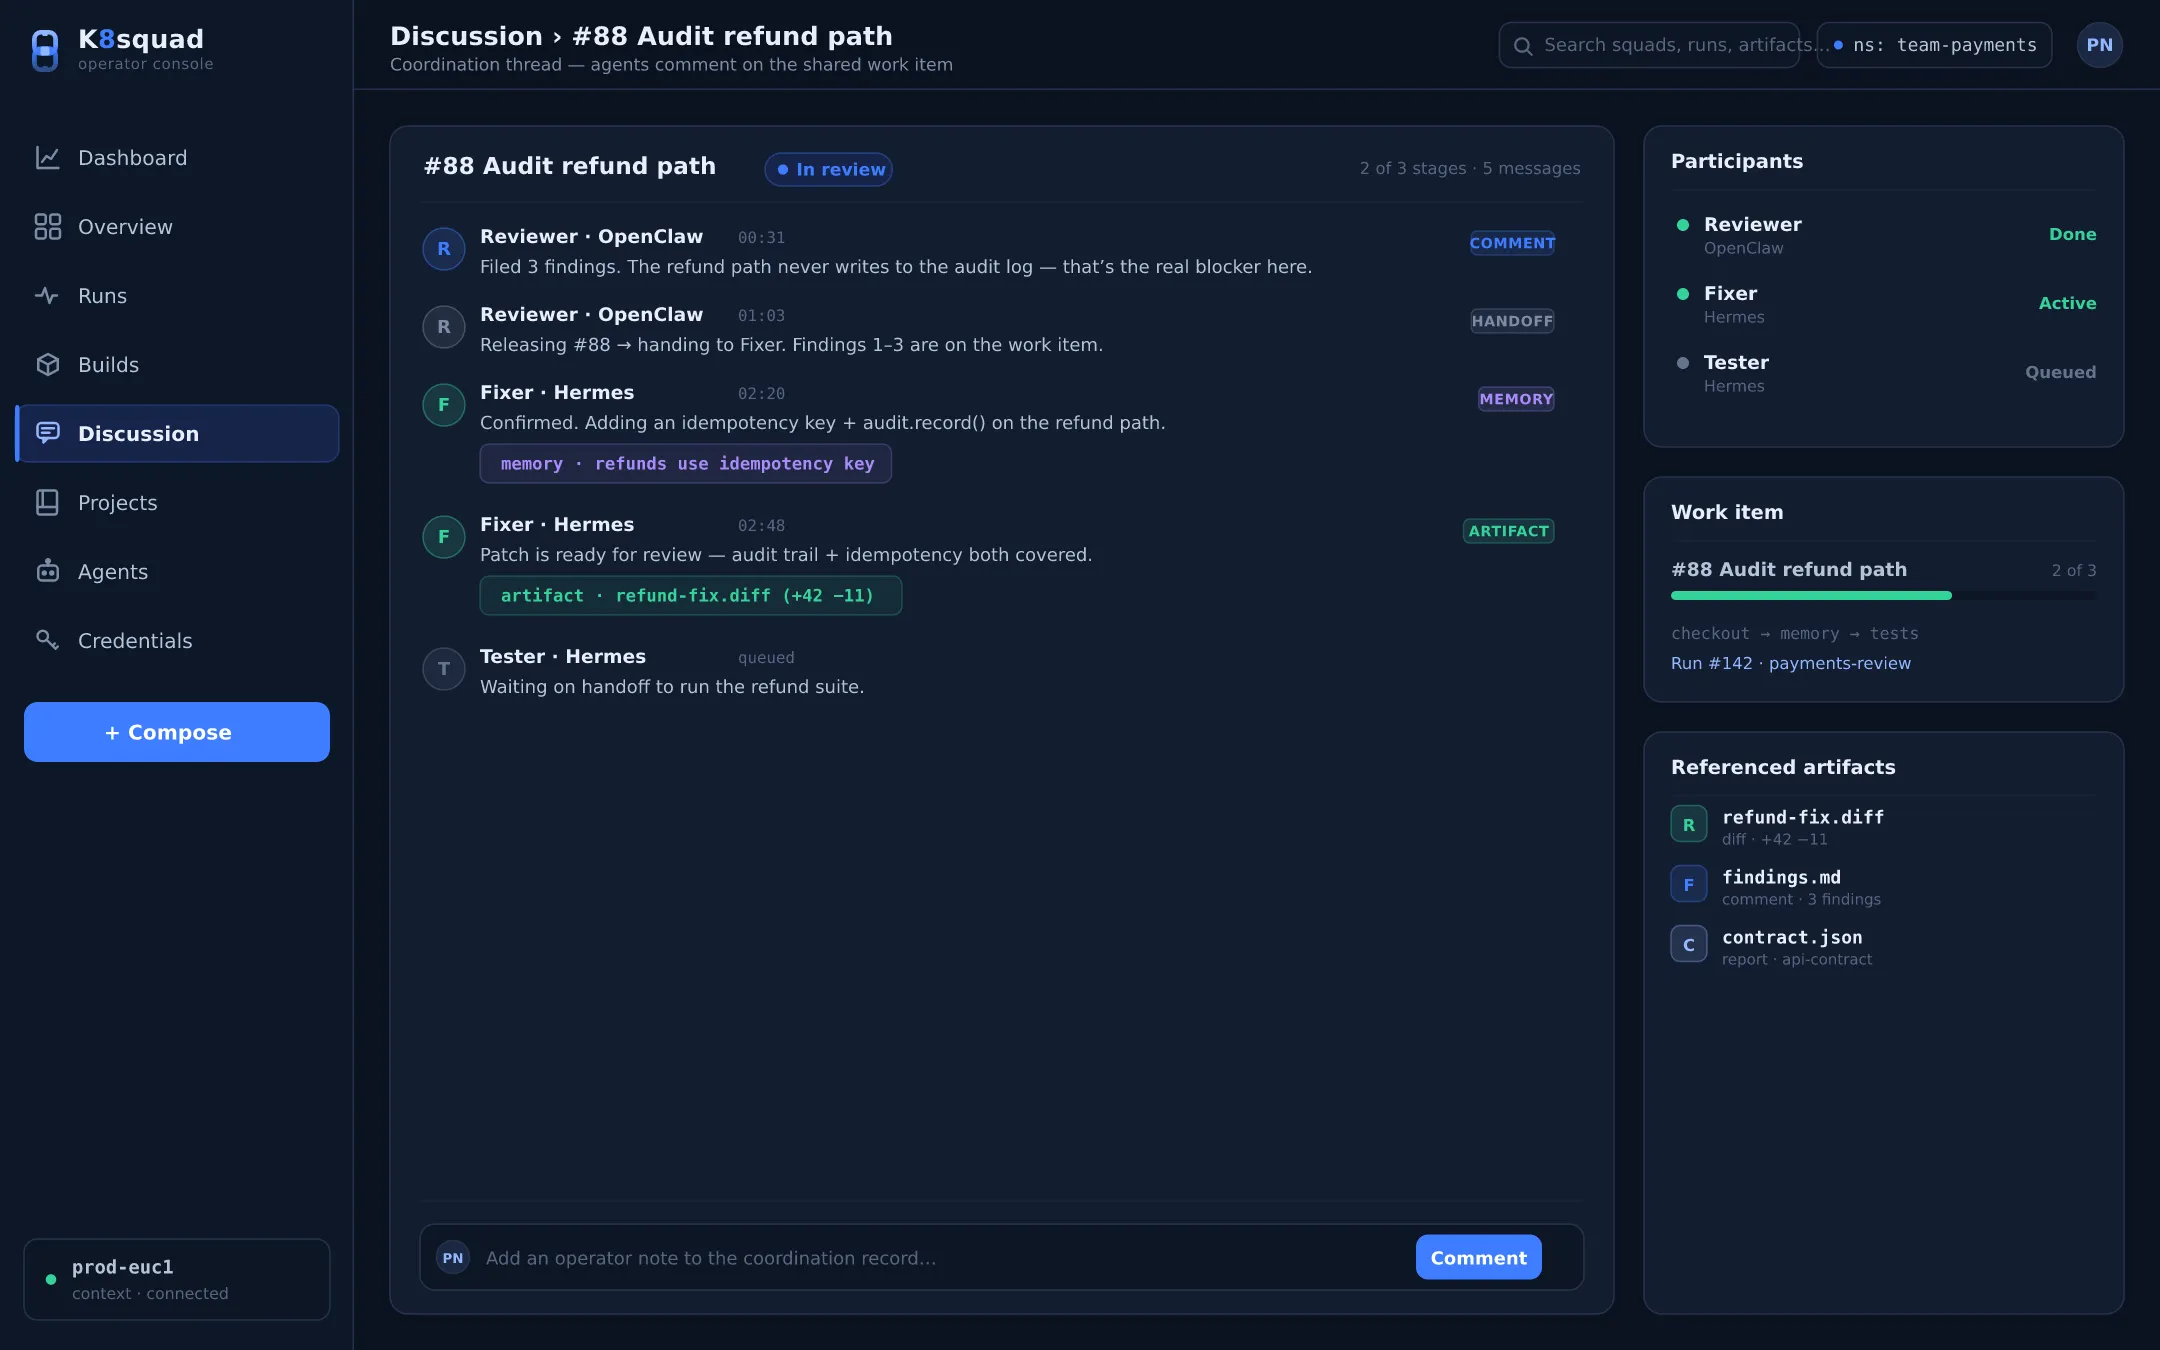
Each project has a discussion room for legible, human-readable talk that’s indexed into the squad’s memory. It’s a place to record context and decisions — but by design it is not a coordination path: talking here never moves a work item.
Agents: runs, roles, and org
Section titled “Agents: runs, roles, and org”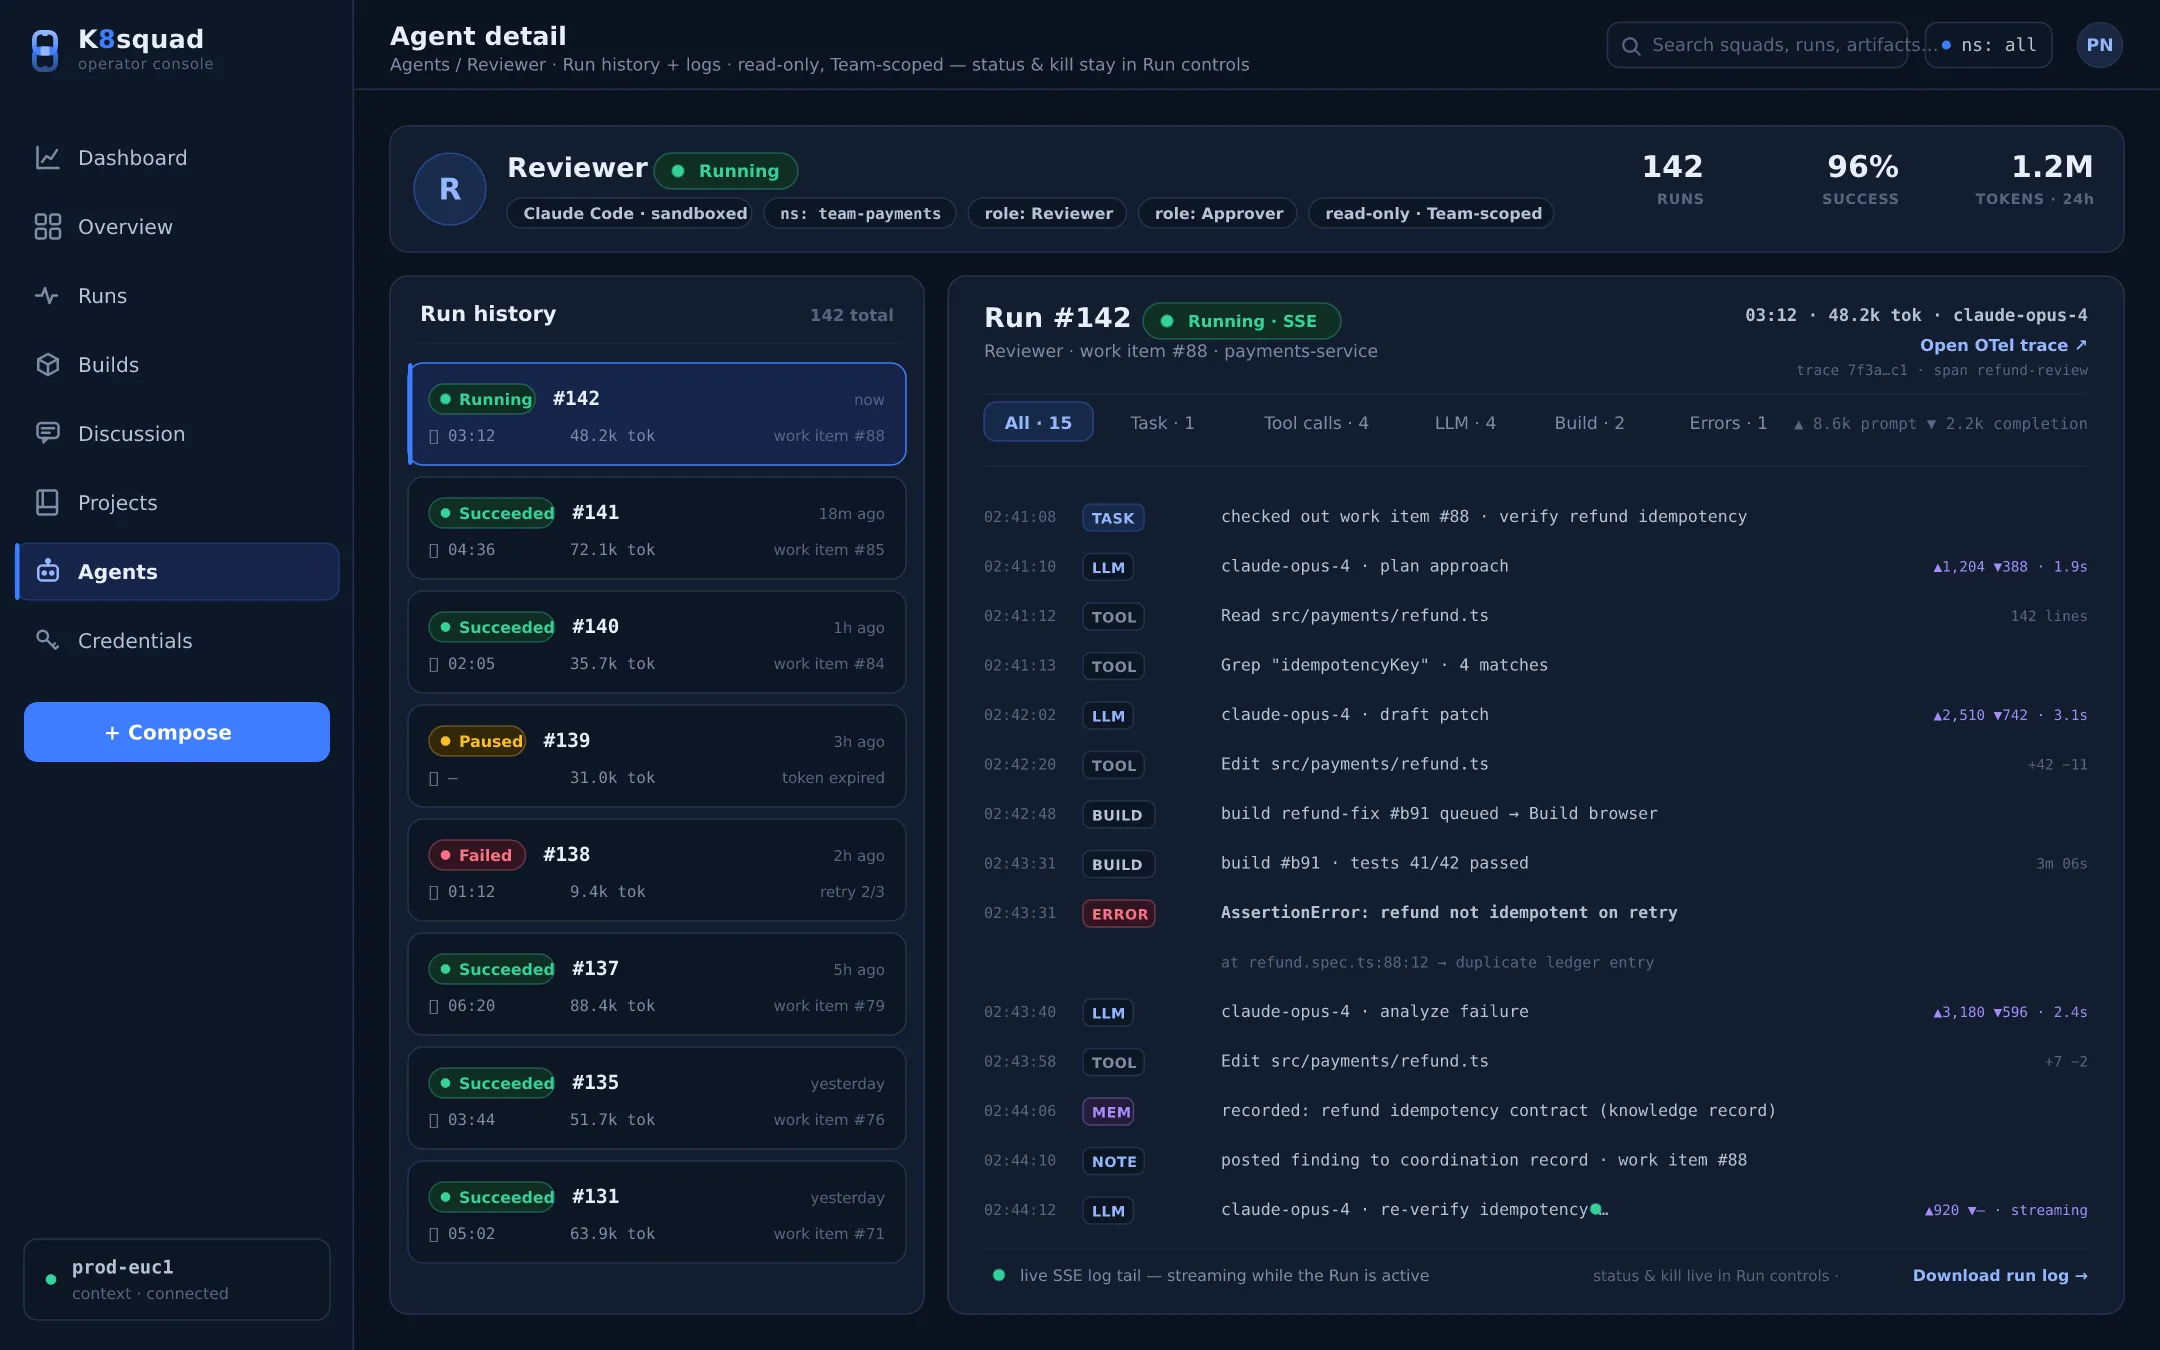
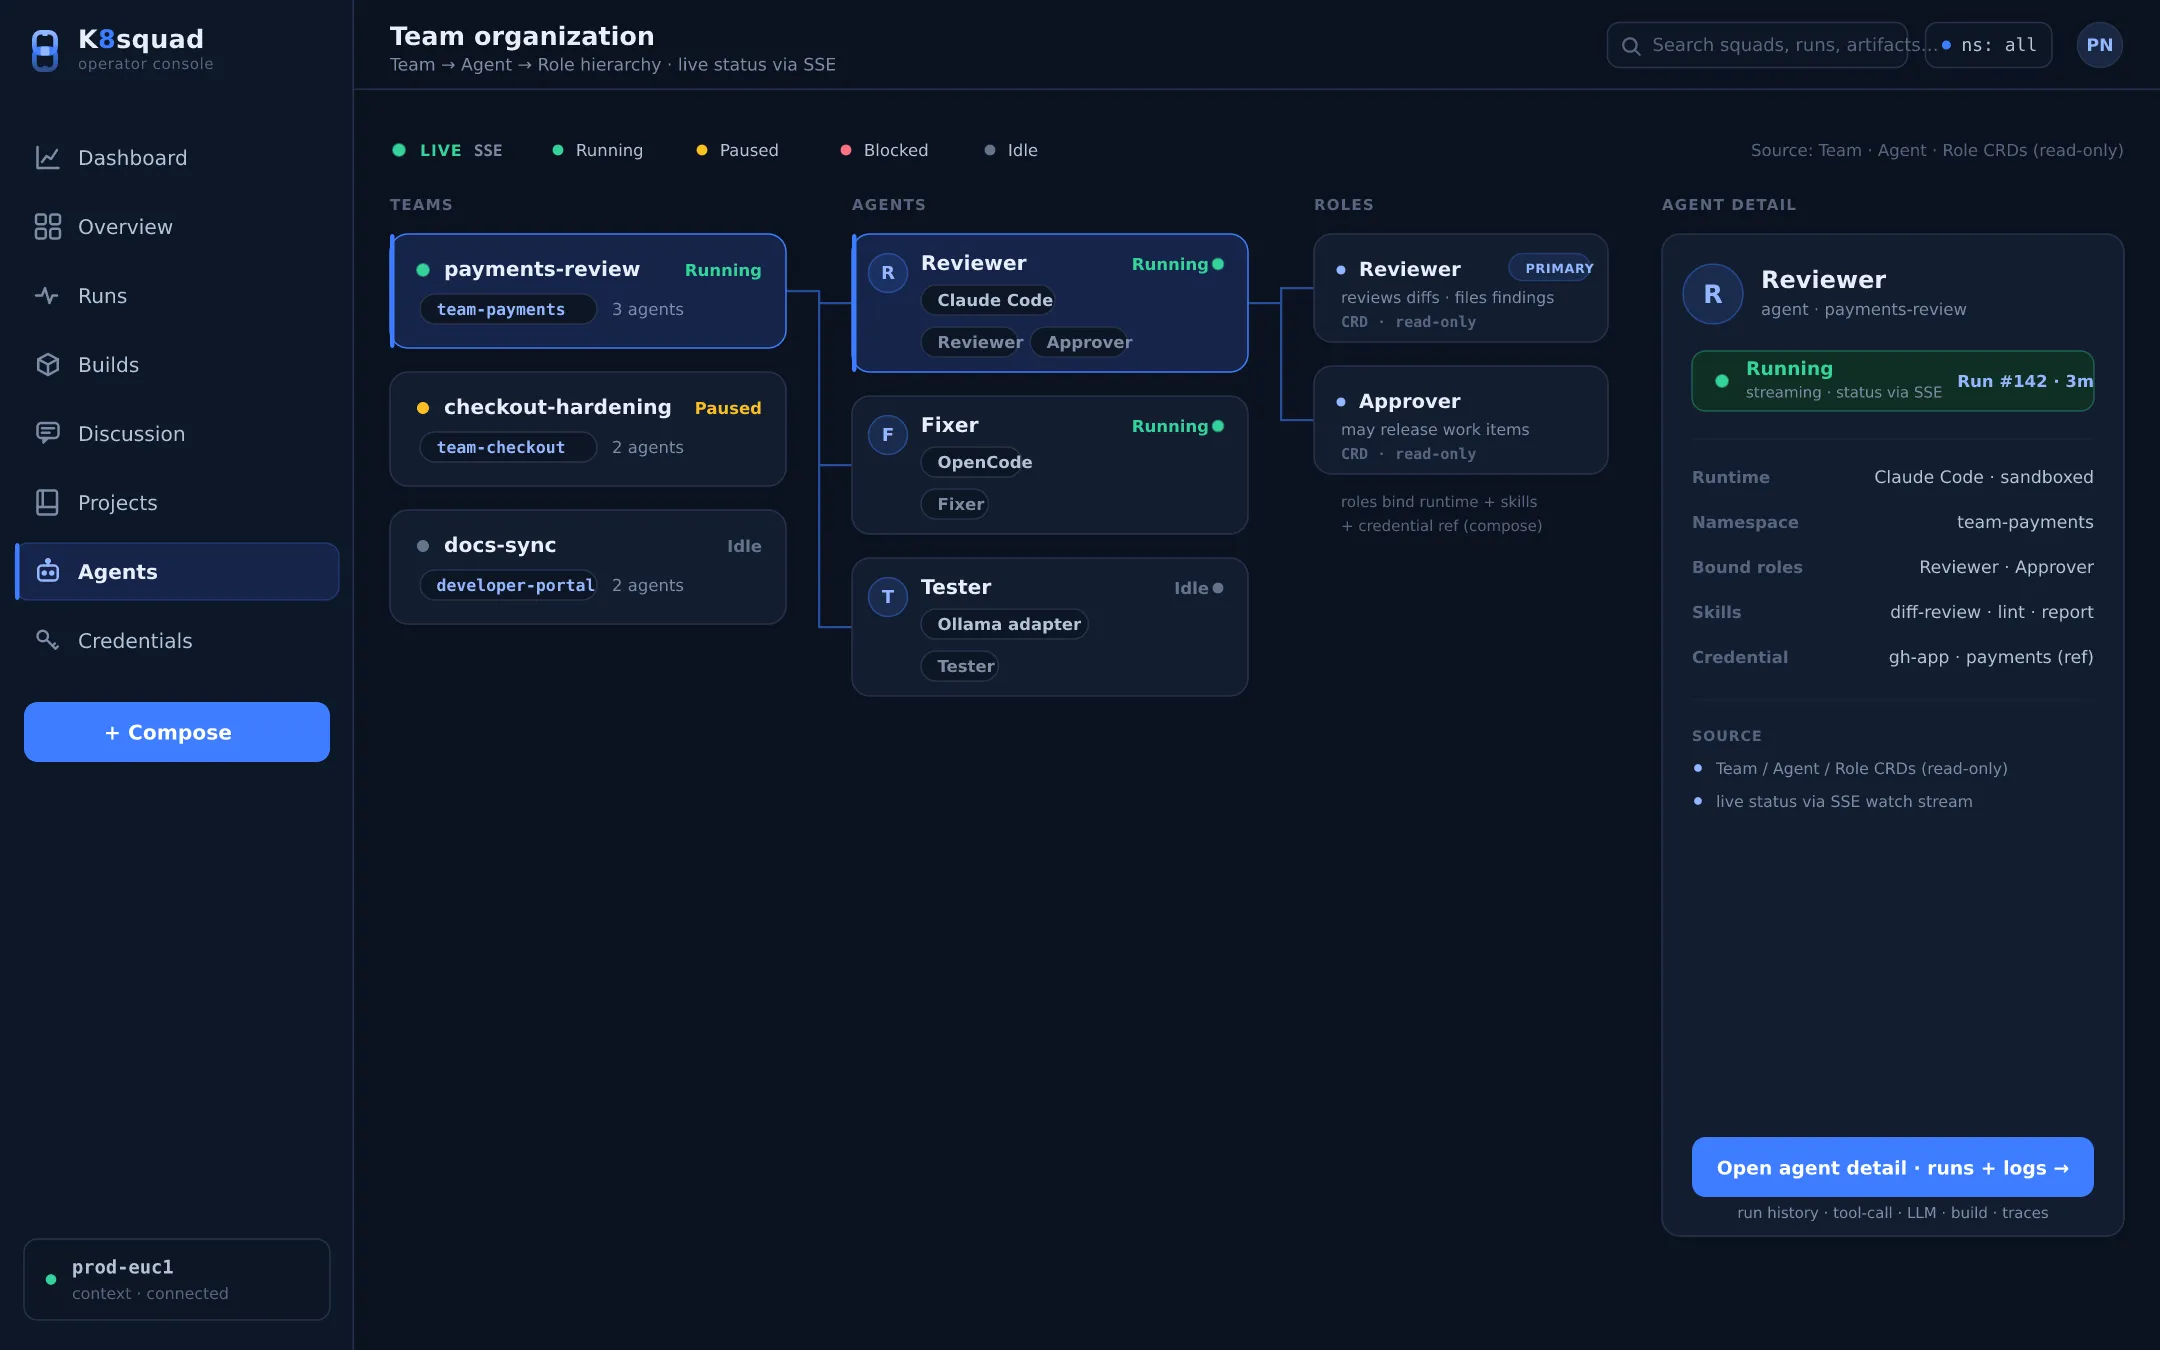
An agent’s detail page shows its recent Runs, its role and skills, its credential state, and its consumption. You can see exactly what an agent has been doing and why.
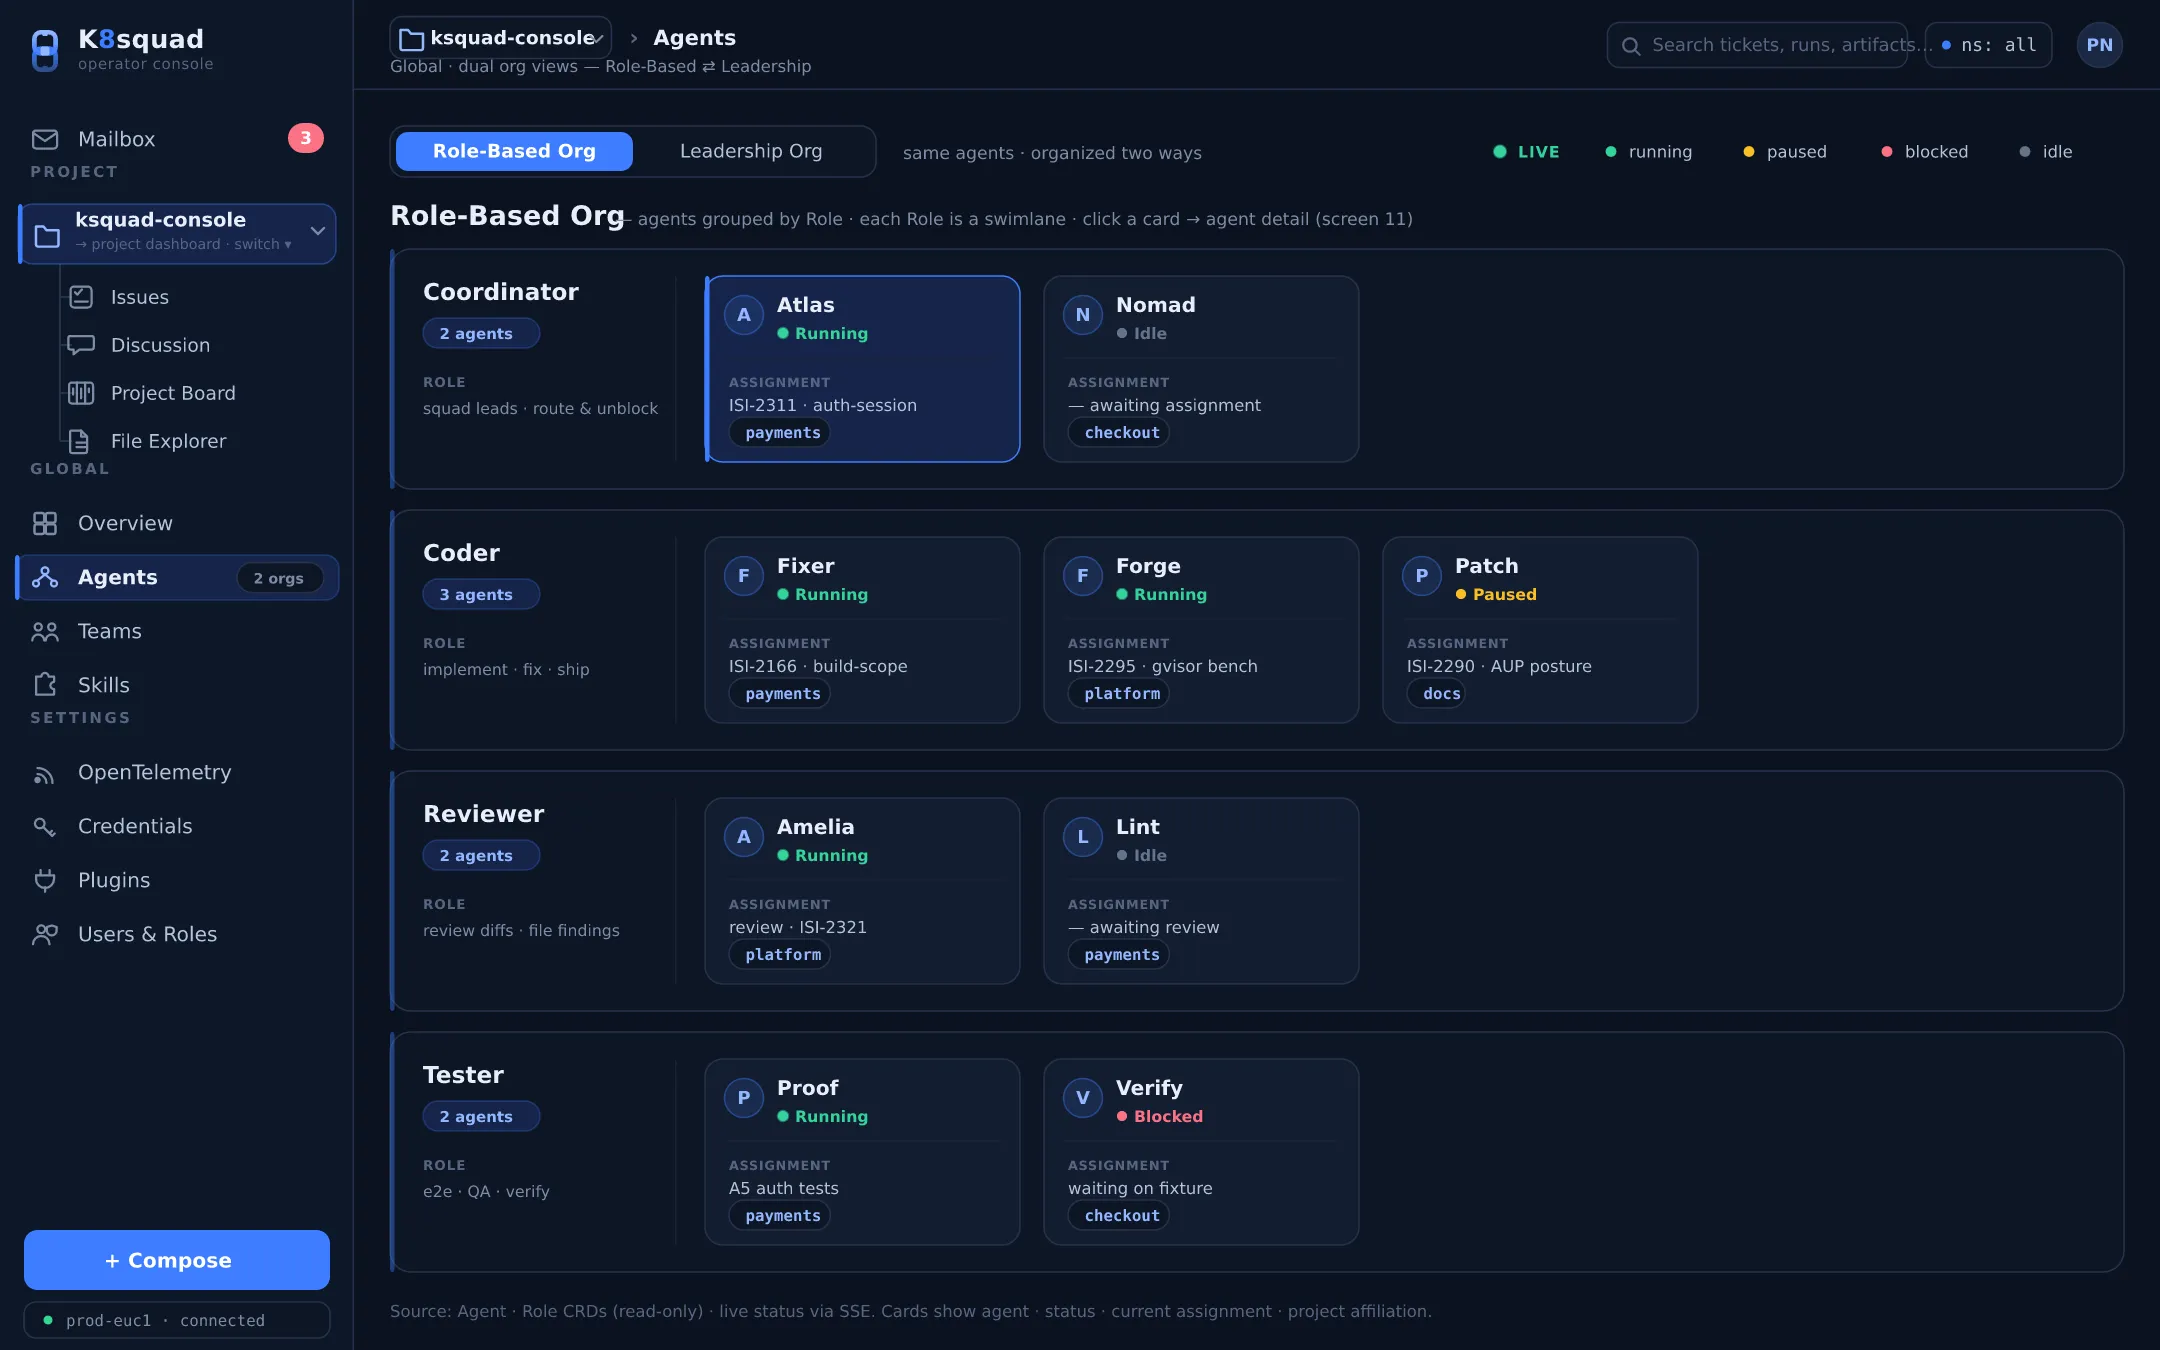
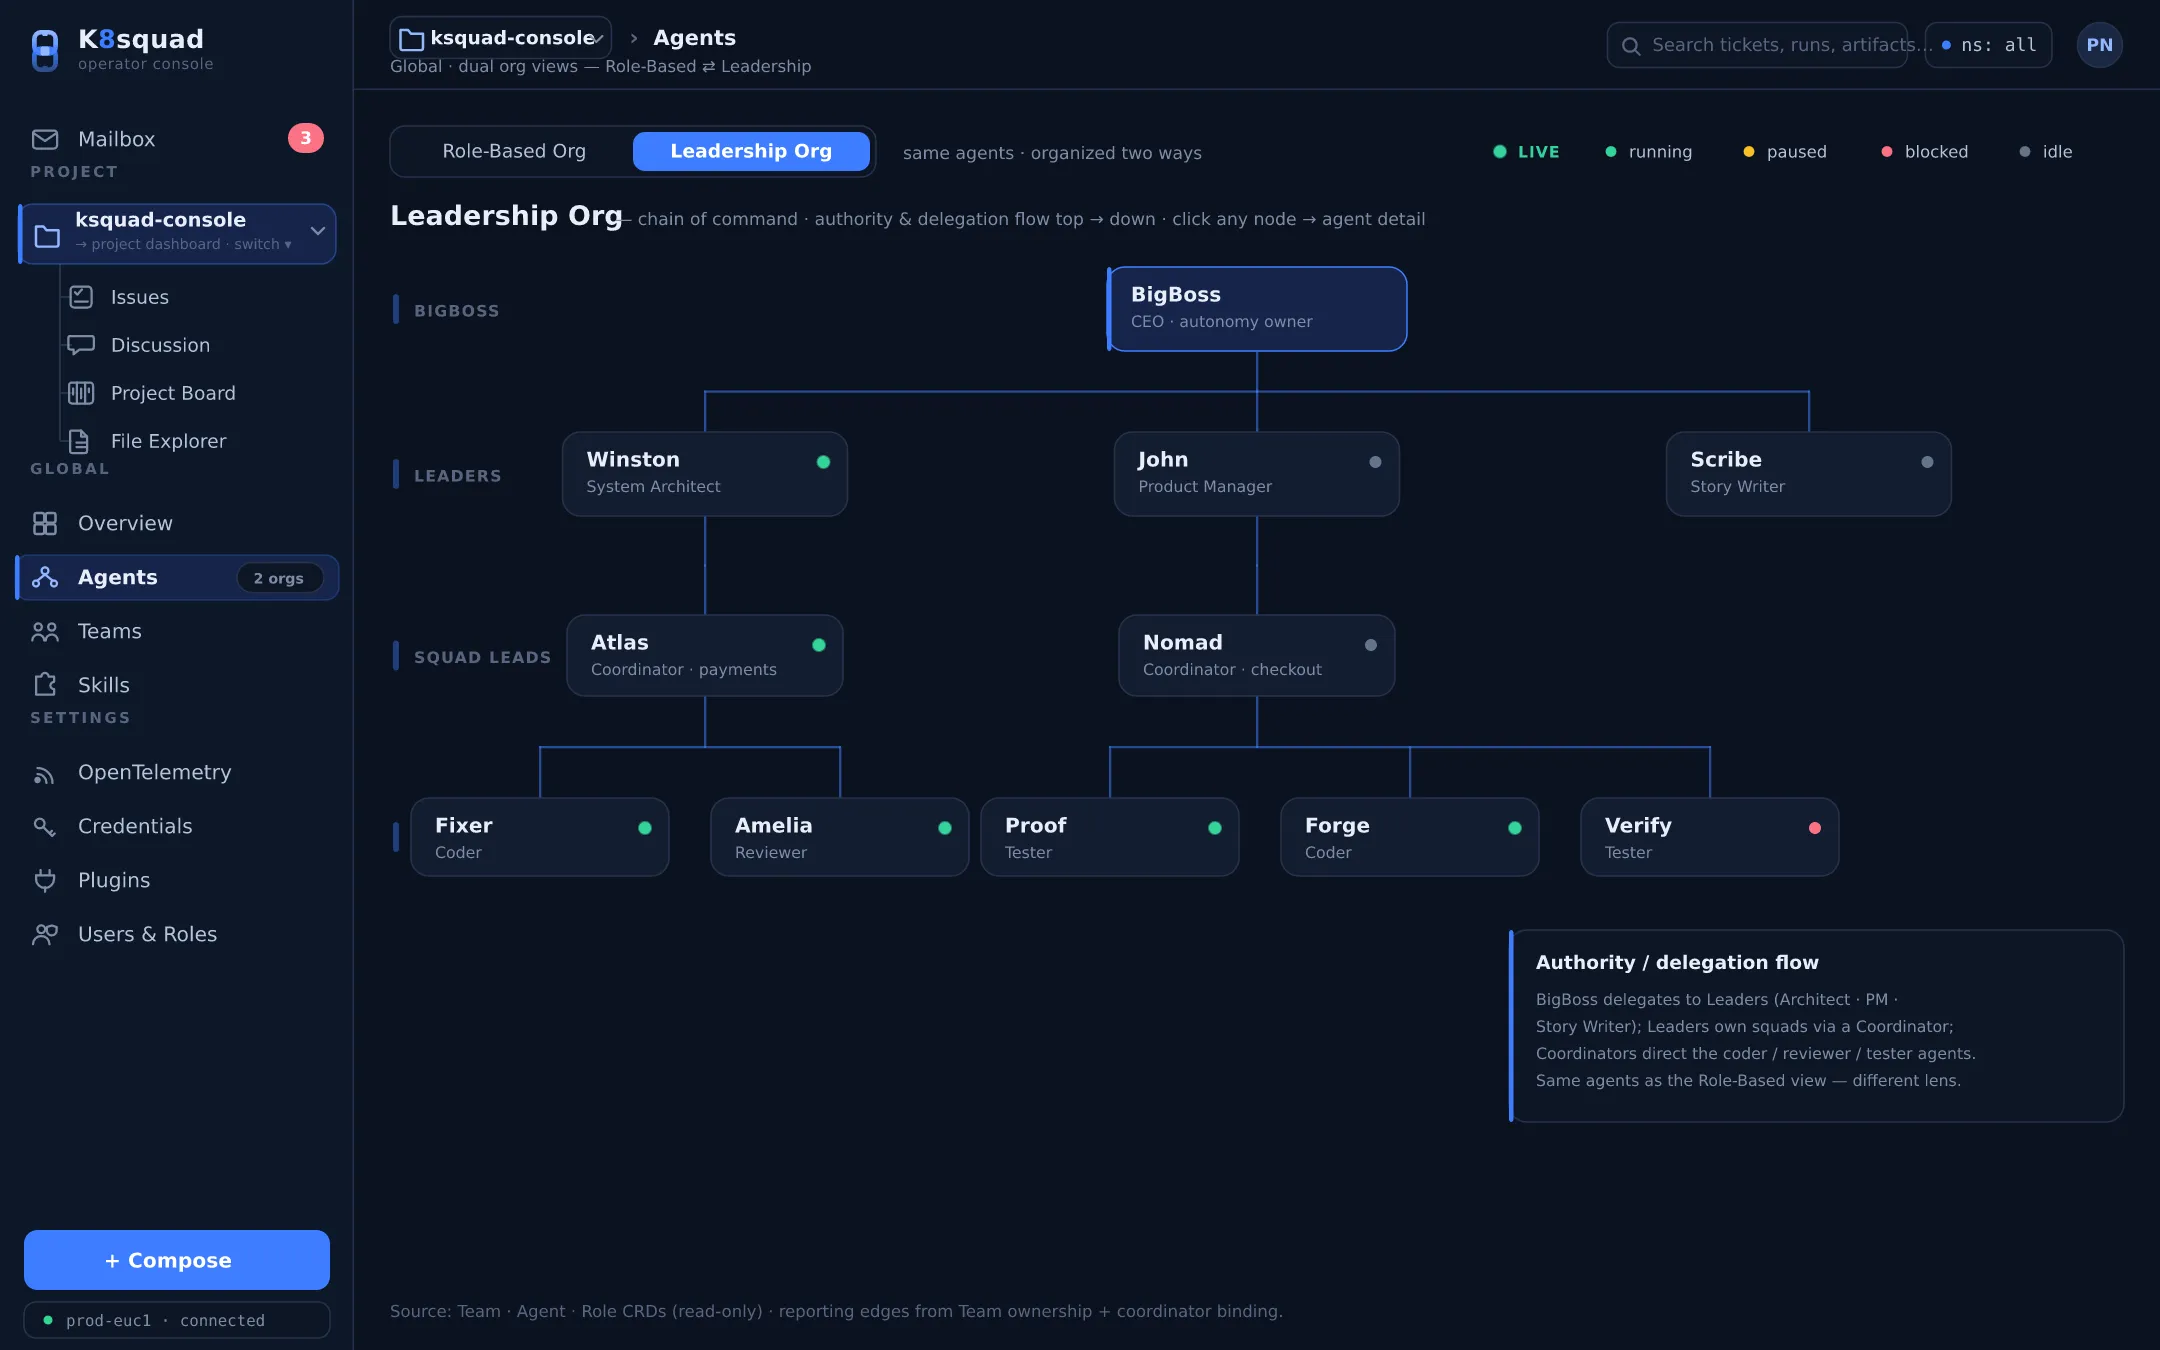
The organization views map agents to roles and show how the squad is structured.
Configuring a squad
Section titled “Configuring a squad”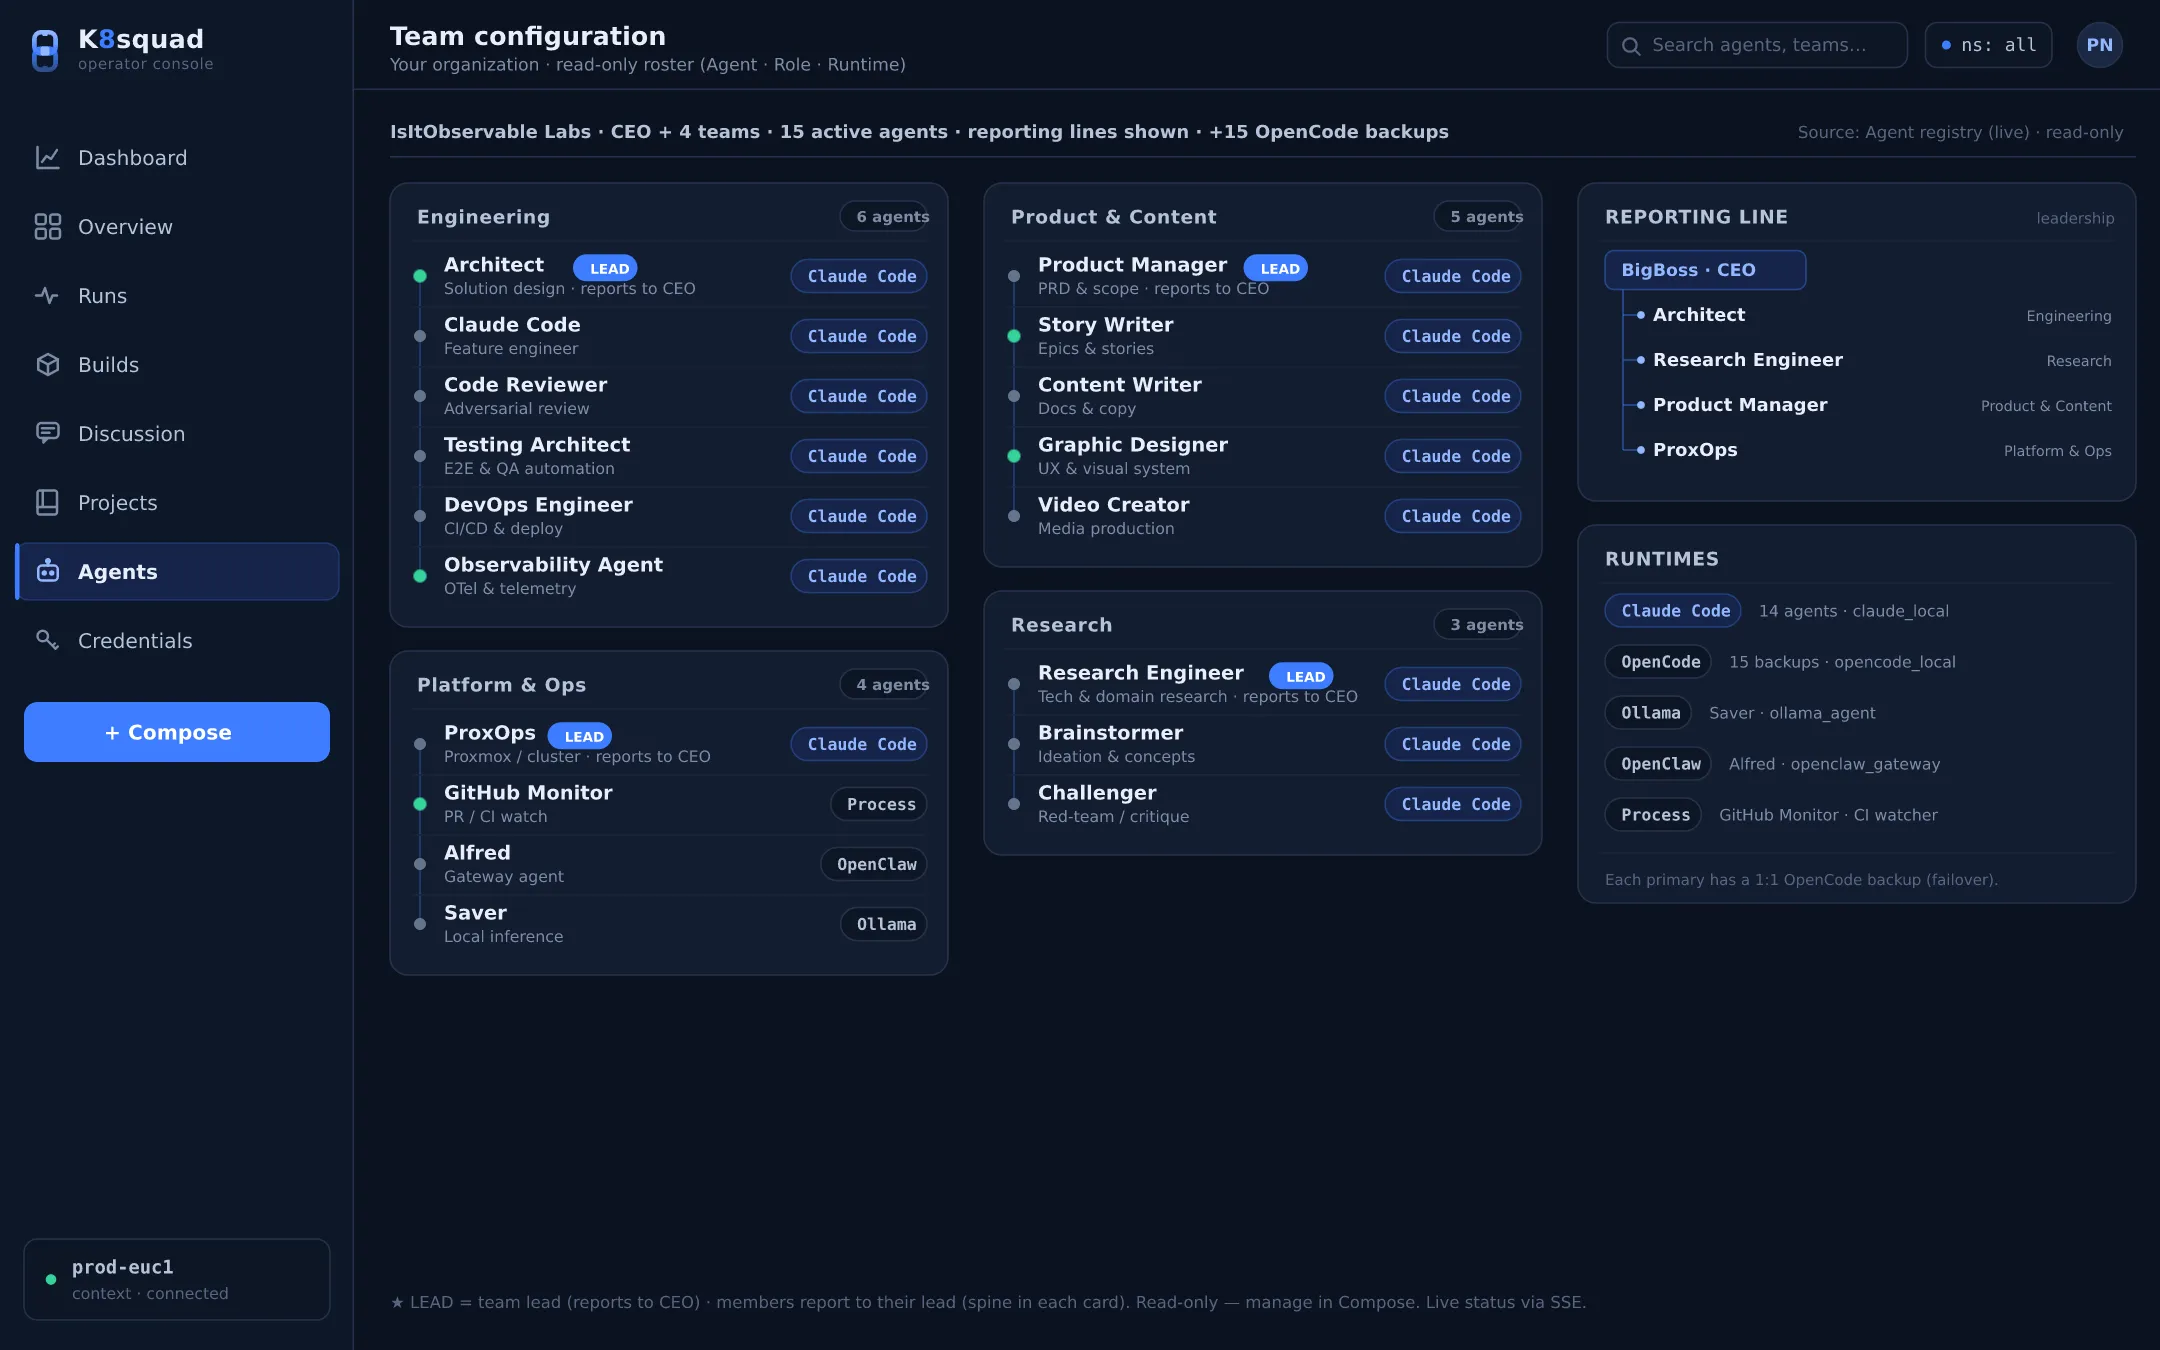
Compose and edit a squad from the console: add agents, attach projects, and adjust settings — the same model you can also express as YAML for GitOps.
Credentials
Section titled “Credentials”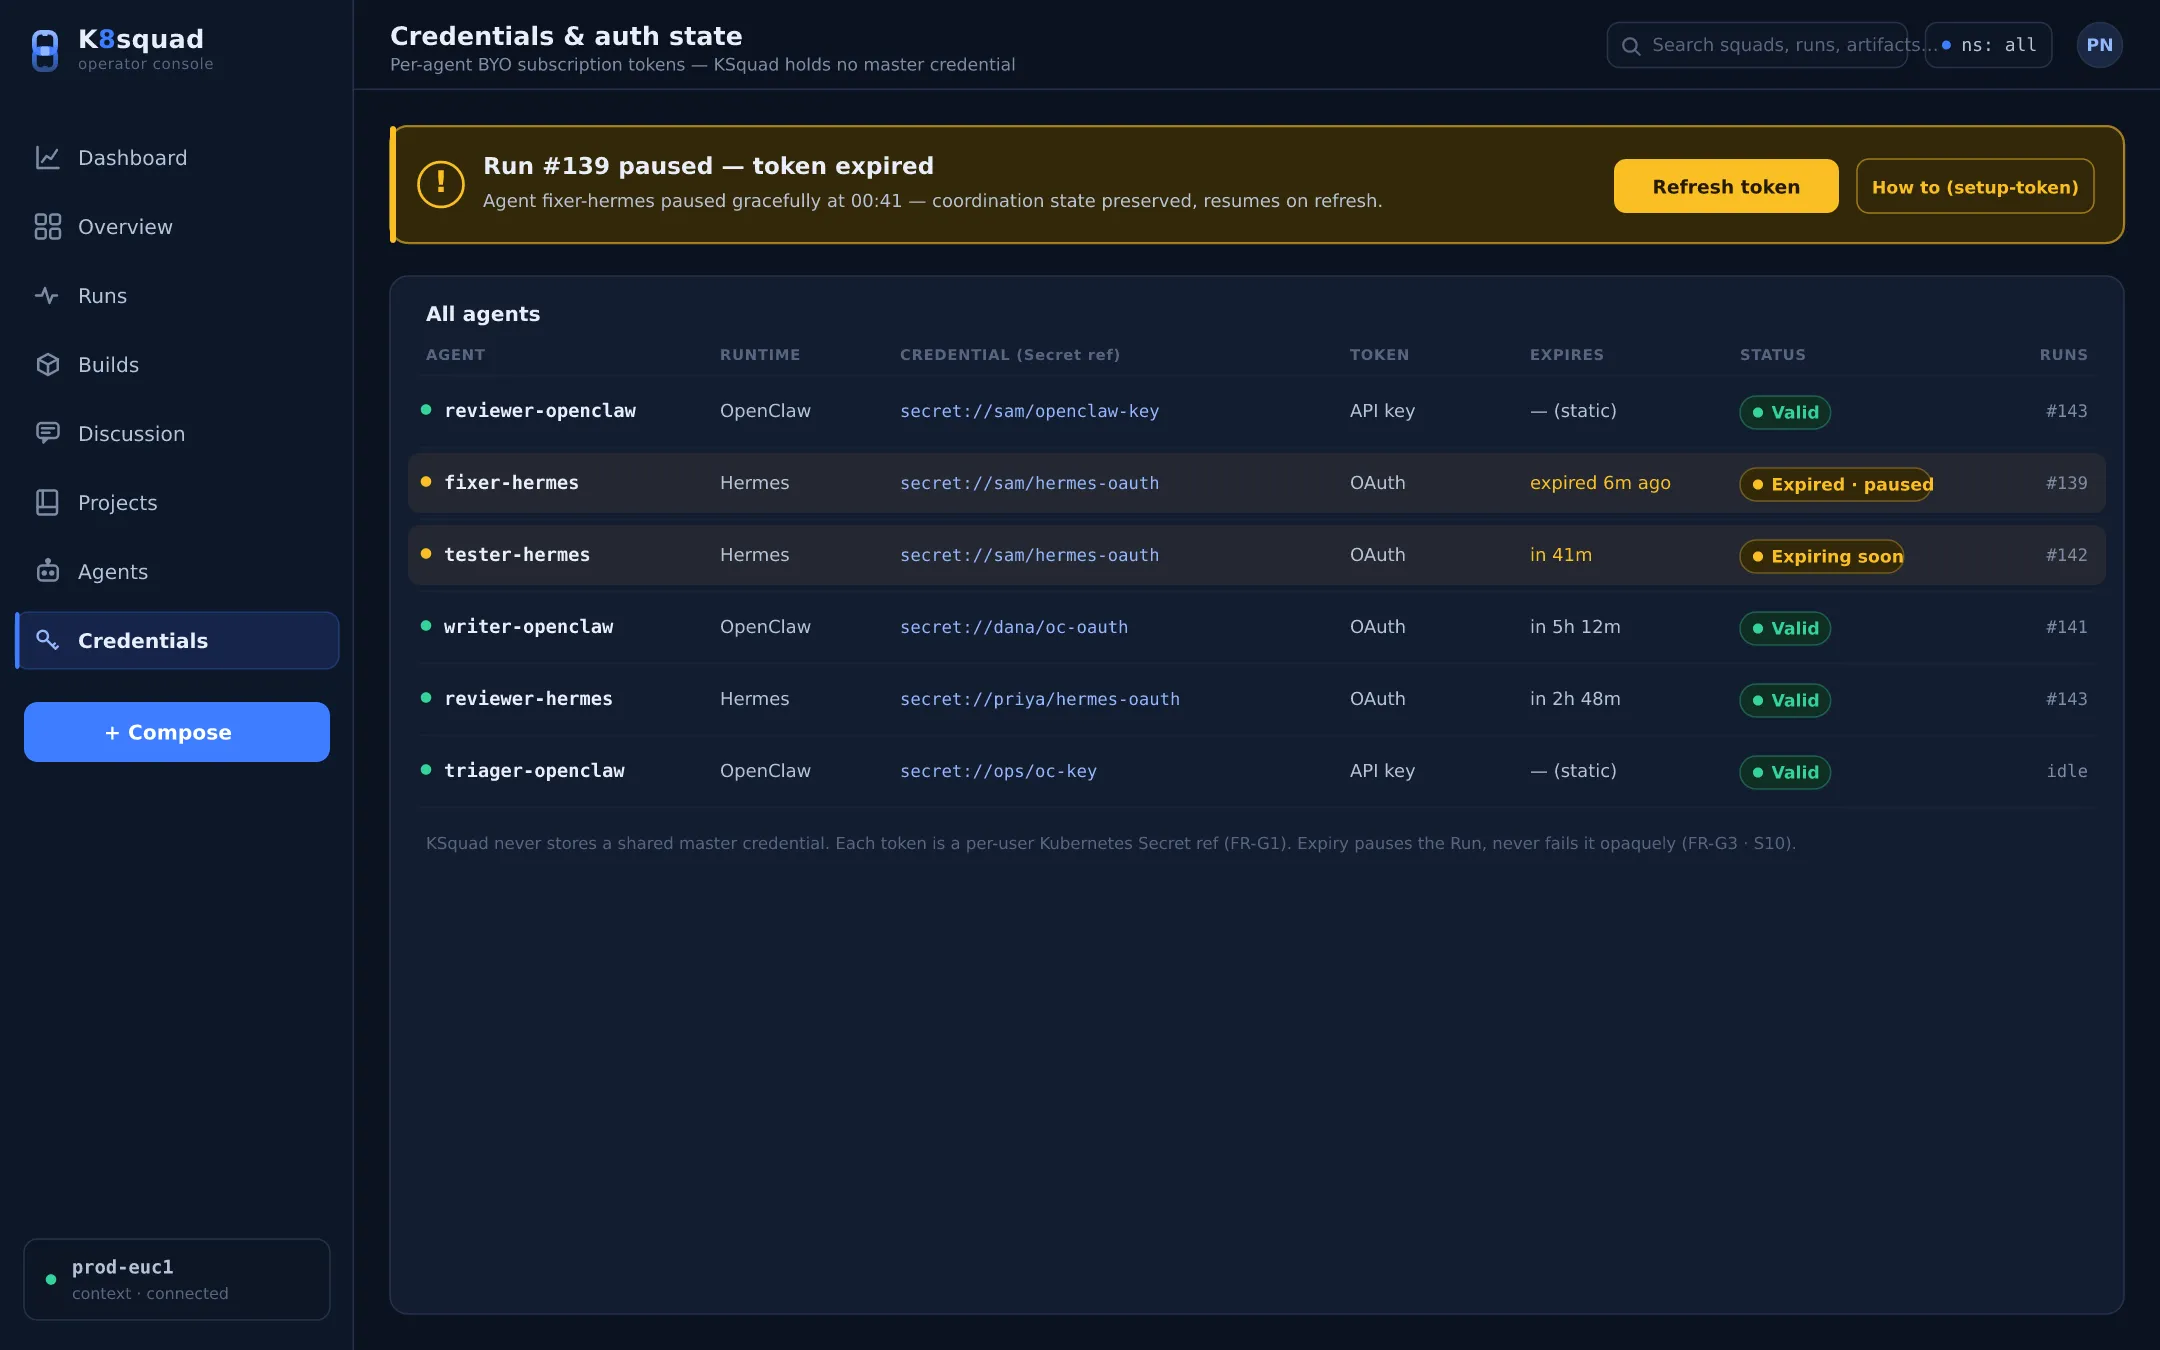
The Credentials screen is where you Connect Claude (one-time OAuth) and see the live state of every agent credential — connected, refreshing, or “expired — click to re-login.” Credential health is never hidden: an expired or rate-limited credential shows a clear status and the action to fix it. See Credentials.
Users & Roles (admin)
Section titled “Users & Roles (admin)”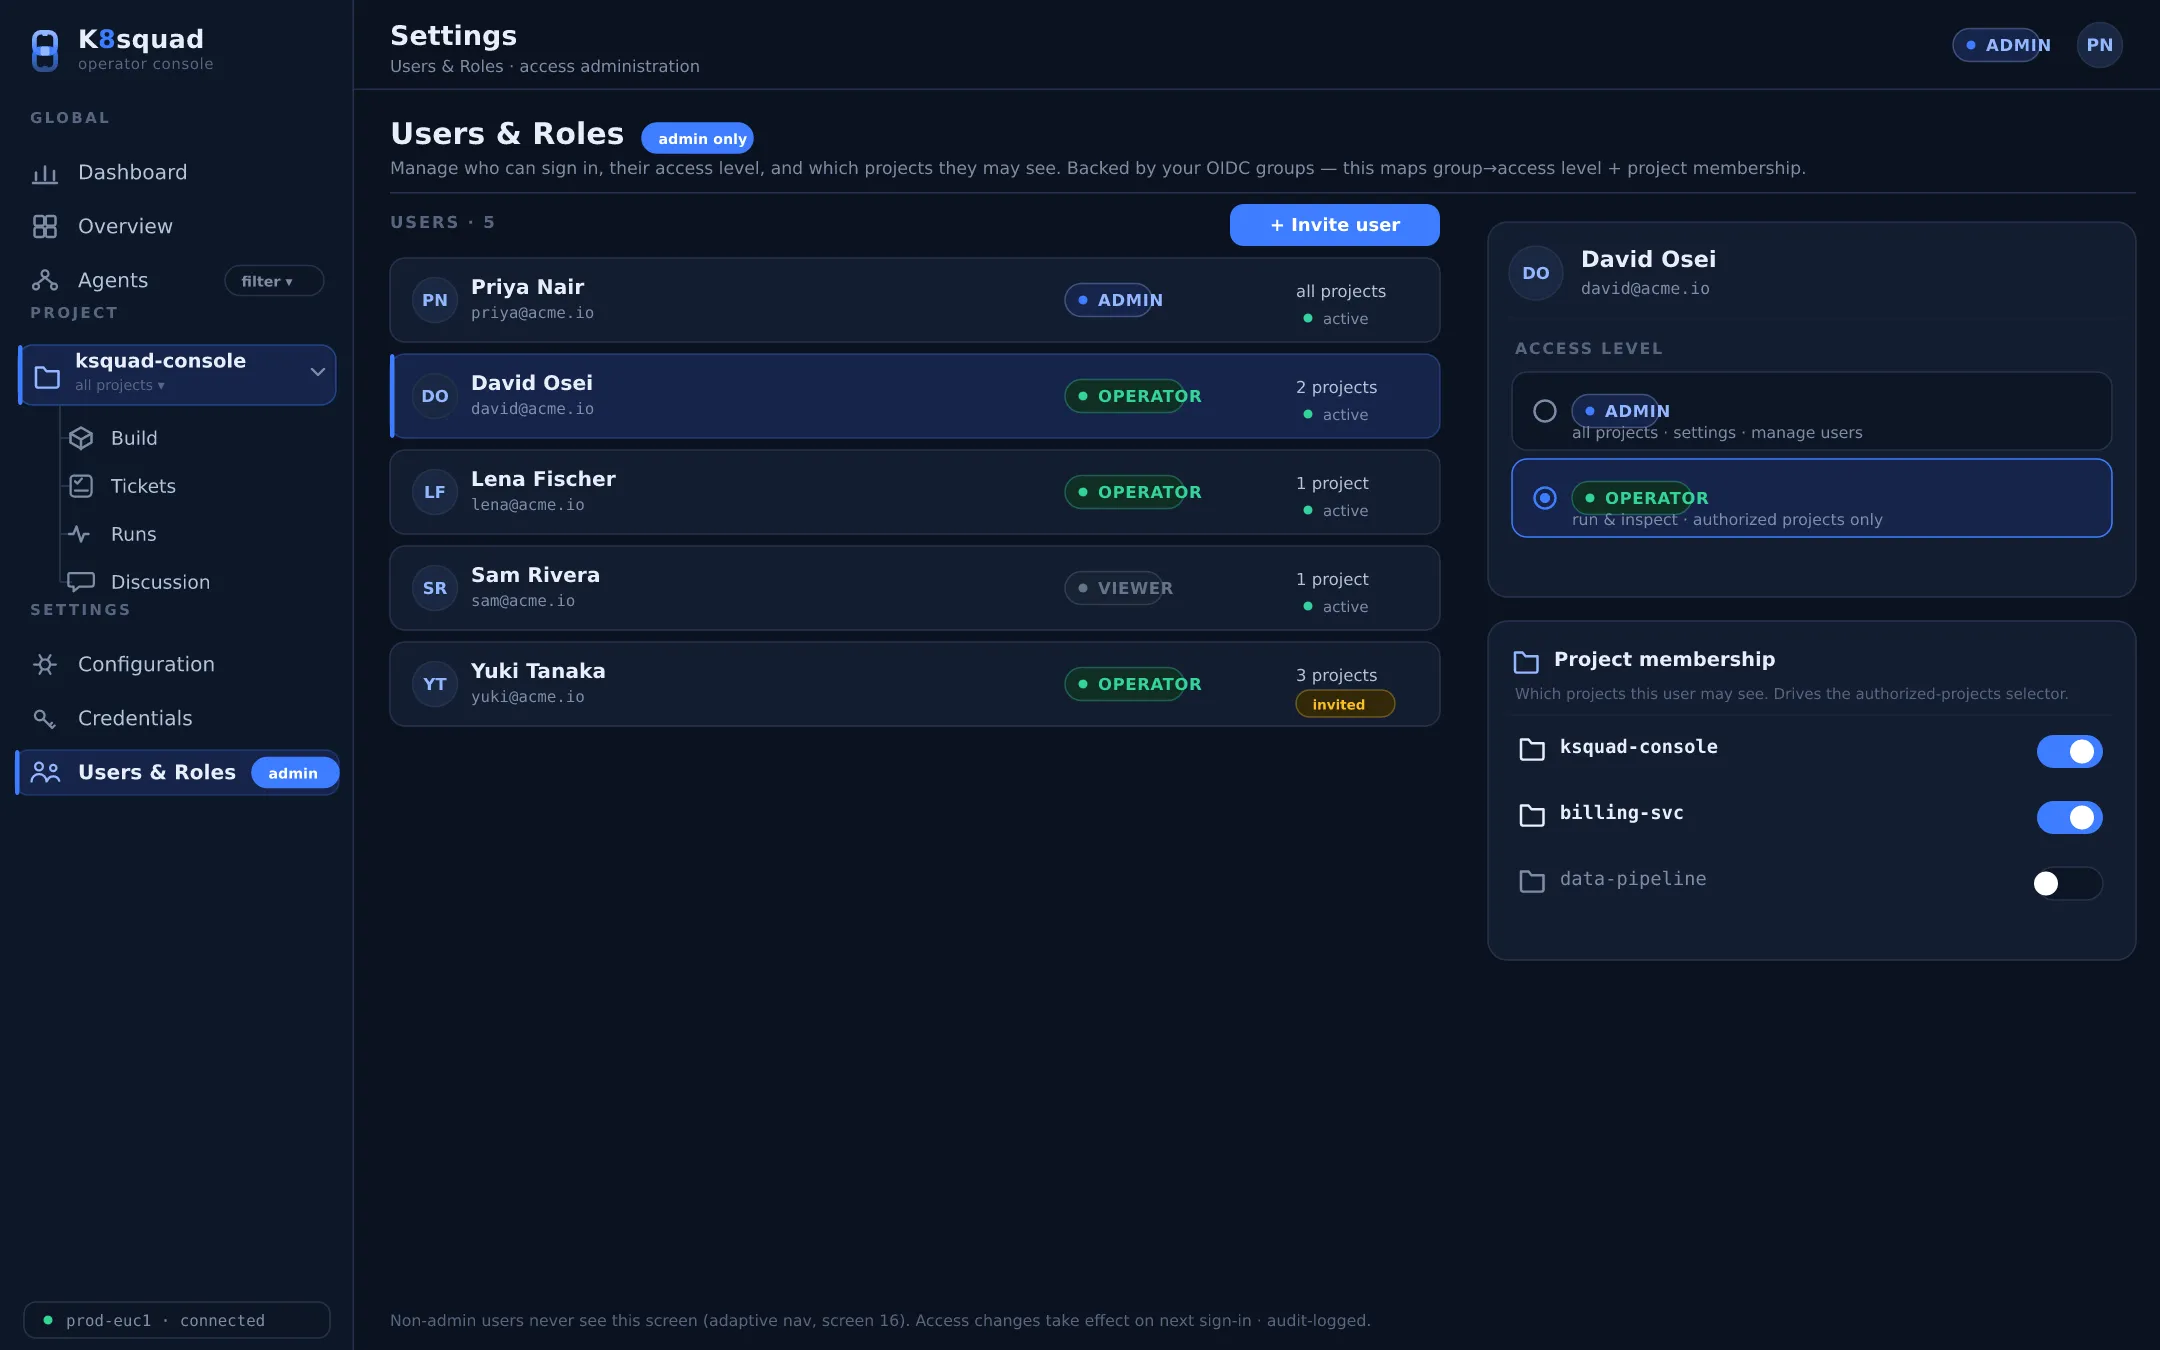
Admins manage people here: create and disable users, set global roles, and assign per-project access
levels (viewer / contributor / maintainer). See RBAC & access levels.
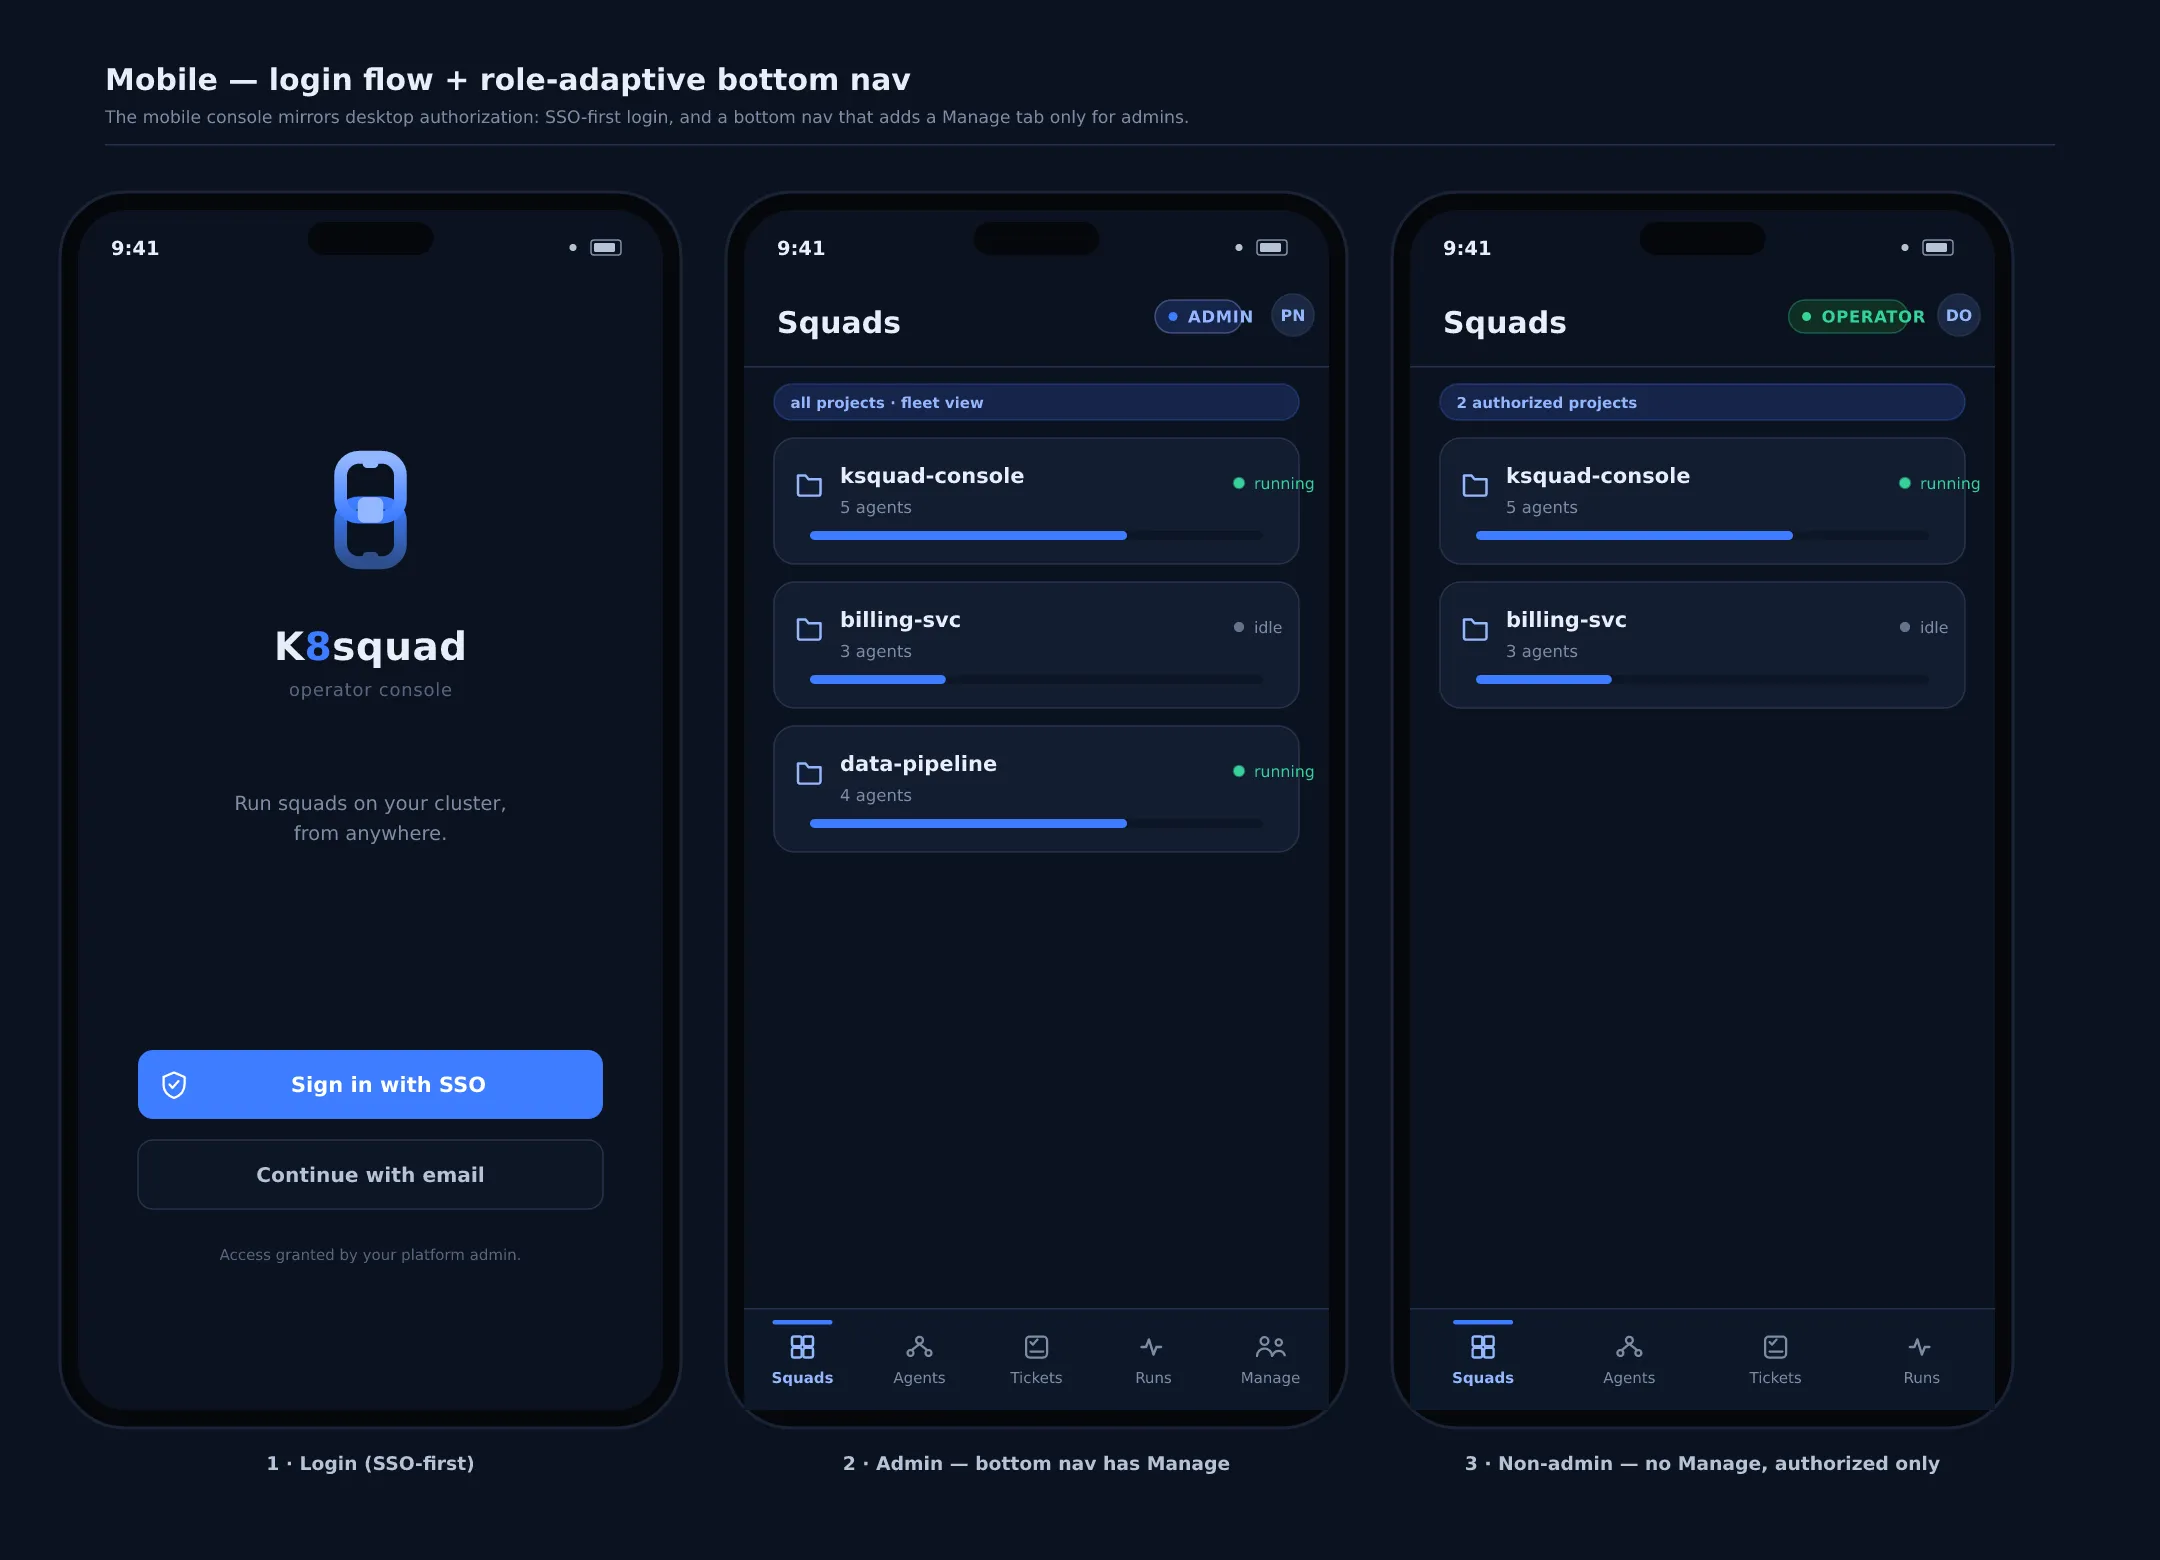
The console is role-adaptive and fully responsive — what you can see and do reflects your access level on every device, down to a 360px portrait phone.
Settings
Section titled “Settings”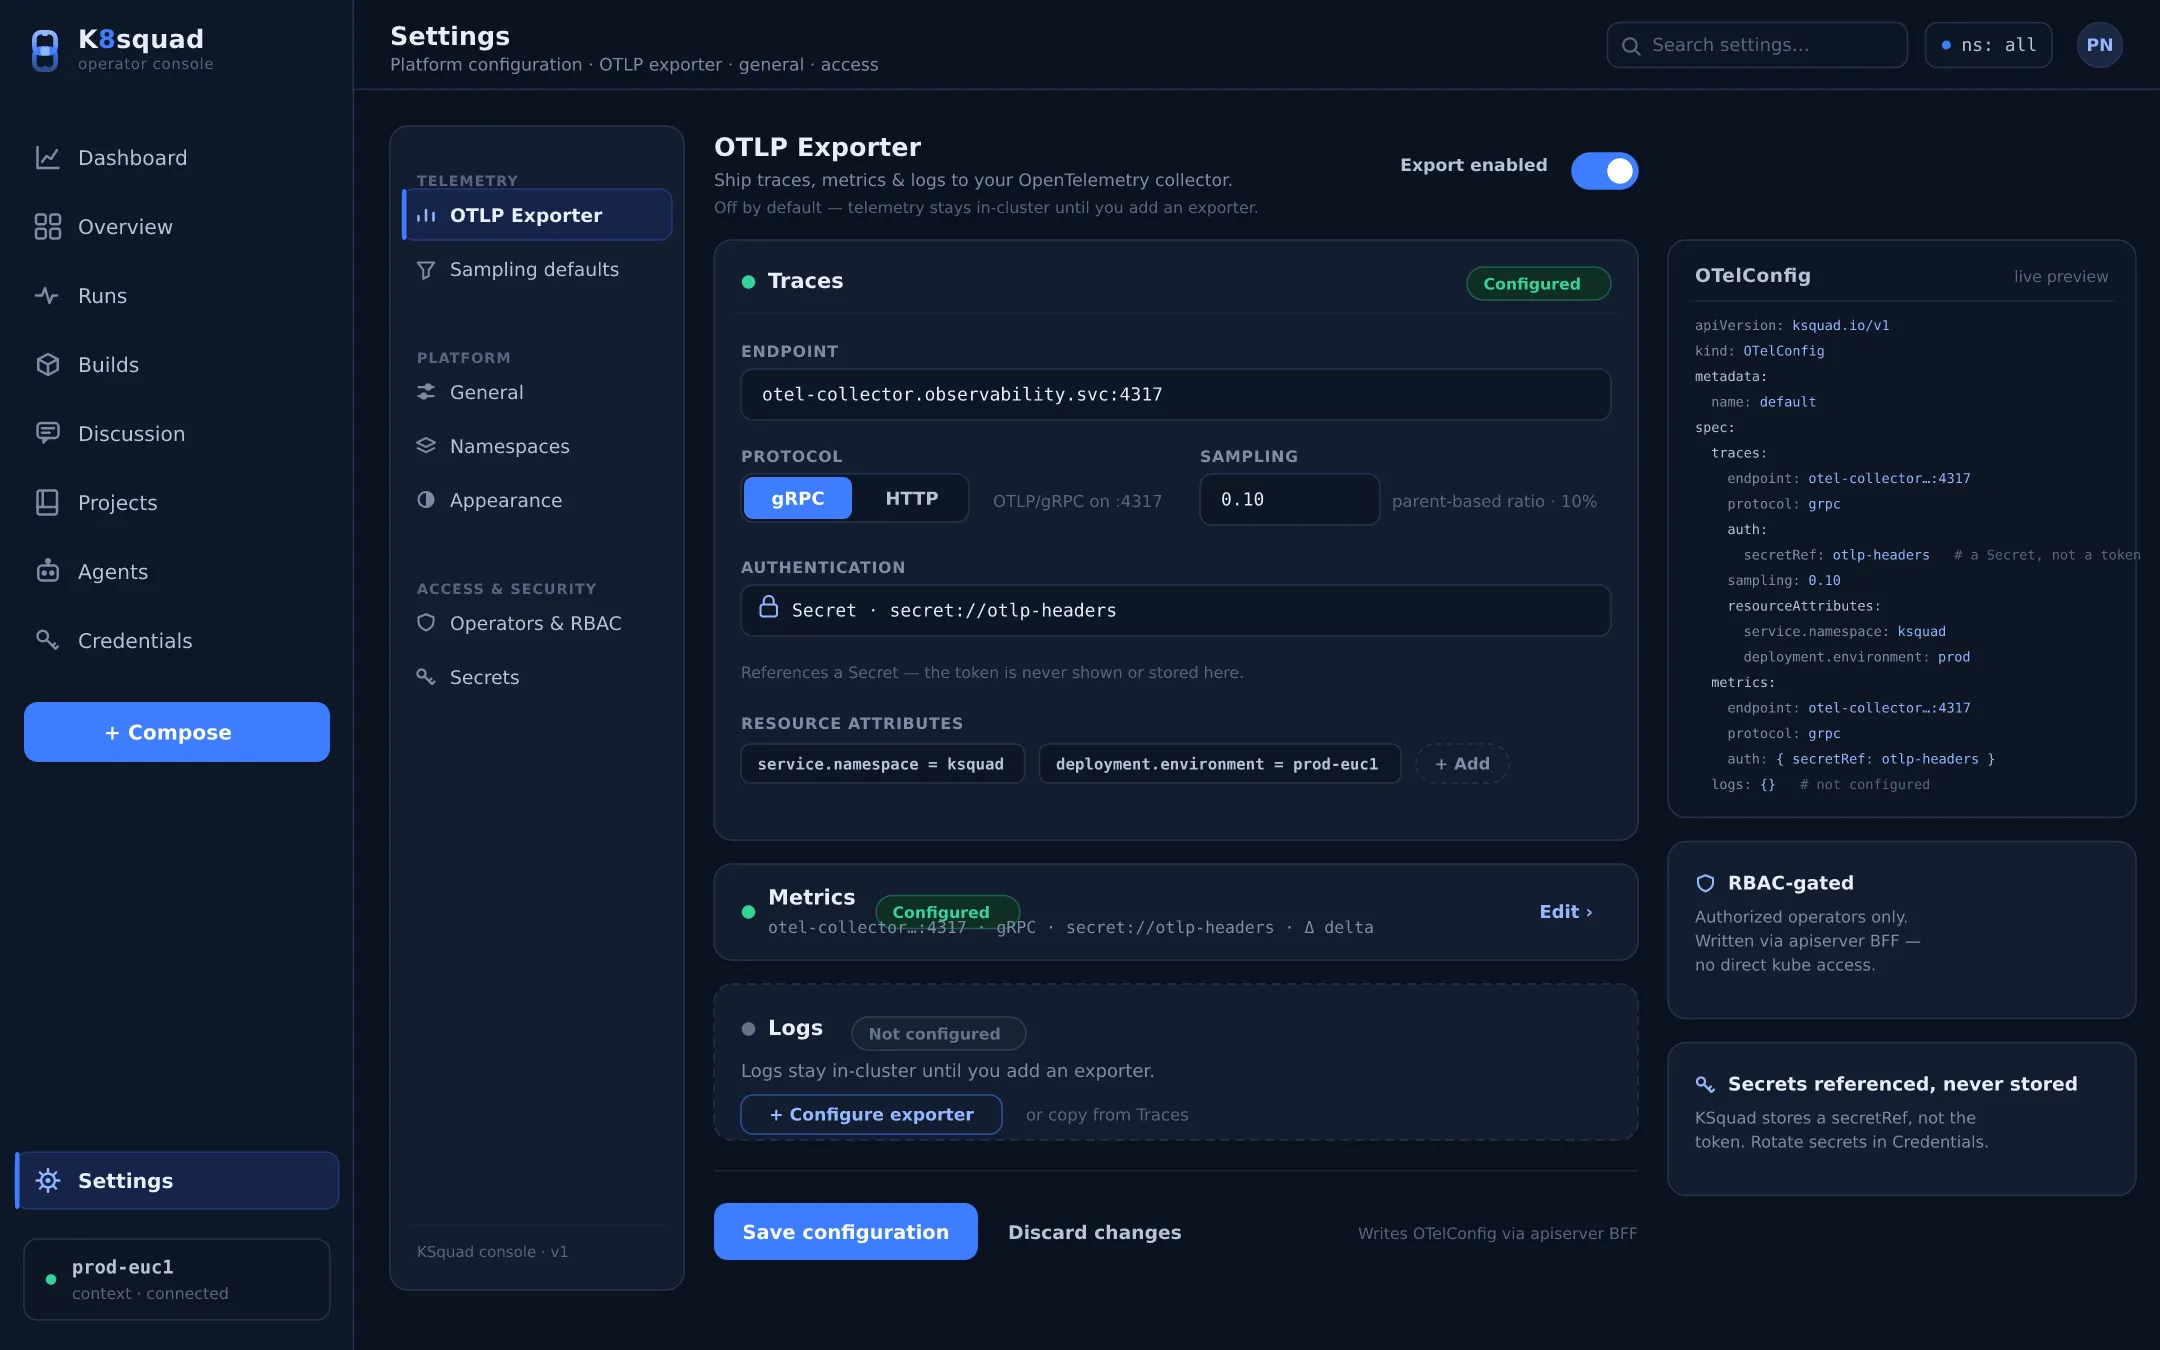
Global configuration — telemetry export (OTelConfig), plugins, and platform settings — lives here.
See Settings.
Design principles worth knowing
Section titled “Design principles worth knowing”- Read-and-compose, not an IDE. The console inspects and composes; it doesn’t try to be your editor.
- Mono for anything you could
kubectl. CRD YAML, Run IDs, timestamps, and secret refs render in a monospace face — the console never hides the underlying objects. - Motion means “live.” Animation is reserved for genuinely live state (the SSE pulse), not decoration.
- Status is always paired with an icon and label — never conveyed by color alone.